
INDEX
1. INTRODUCTION
2. PREPARATION OF SHOE PRIOR TO TESTING
3. MIDSOLE BEND TEST METHODOLOGY
4. FOREFOOT FLEX TEST METHODOLOGY
5. MIDSOLE TORQUE TEST METHODOLOGY
6. HEEL COUNTER STIFFNESS TEST METHODOLOGY
7. RESULTS
8. RESULTS SUMMARY TABLE
Introduction
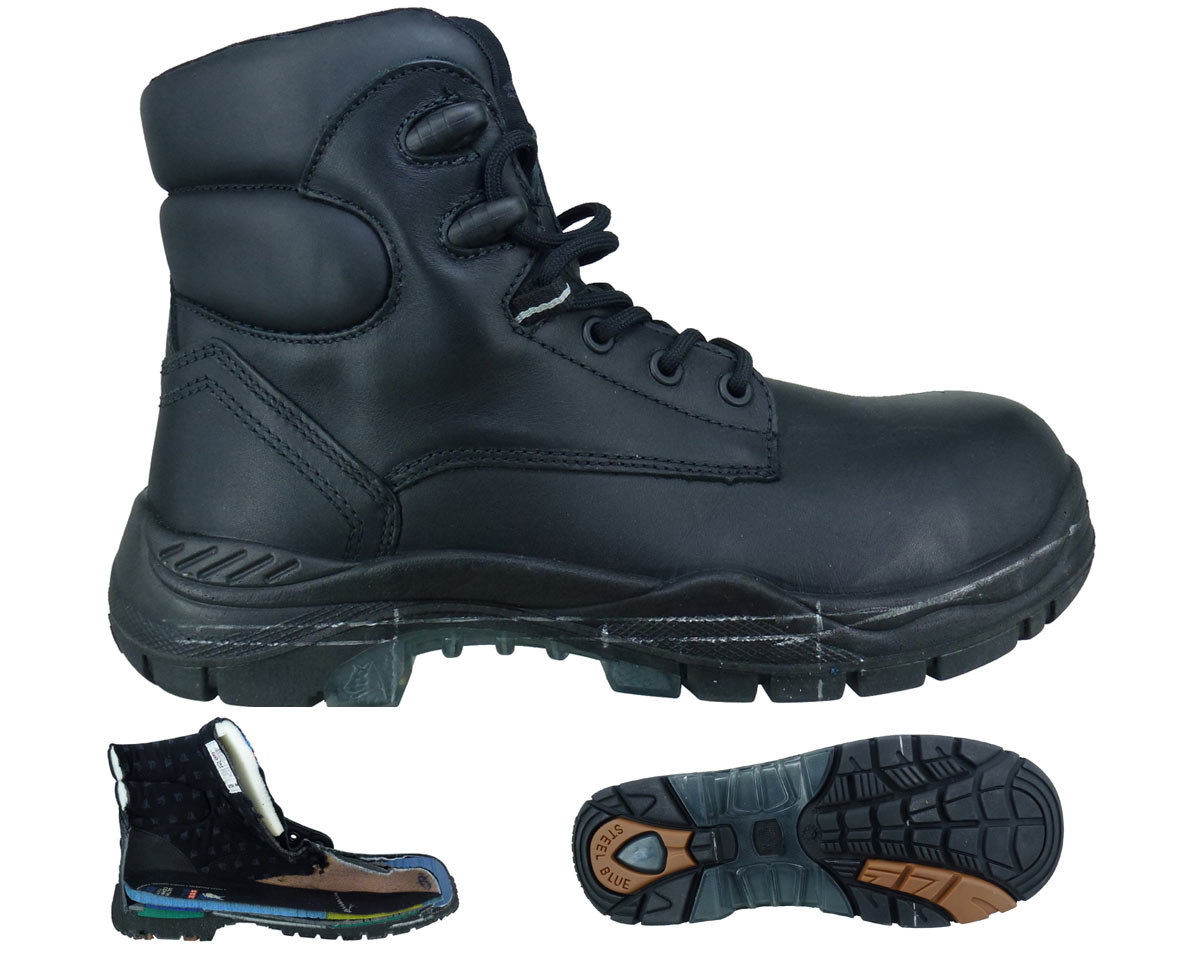
This study was undertaken to assess the characteristics of a sample of five safety boots from four manufacturers. "What is a safety workboot? For decades, workers have been required to wear safety workboots within many industrial settings. To date, the main safety feature inside workboots has been the protective toe piece, with little attention given to other key biomechanical features of a workboot that help prevent other common injuries we see in the workplace today such as severe plantar fasciitis, crow’s feet (tendon/fascia strain), acute hip, knee or back pain, ankle injury and broken elbows and wrists.
Safety workboots sold in Australia & New Zealand must adhere to AS/NZS 2210.3-2009. The AS/NZ standard tests features such as the strength of the safety toe via a drop and compression test, upper to outsole bonding, upper breathability, outsole abrasion and flex test and outsole resistance to fuel, oil and acid and slip resistance.
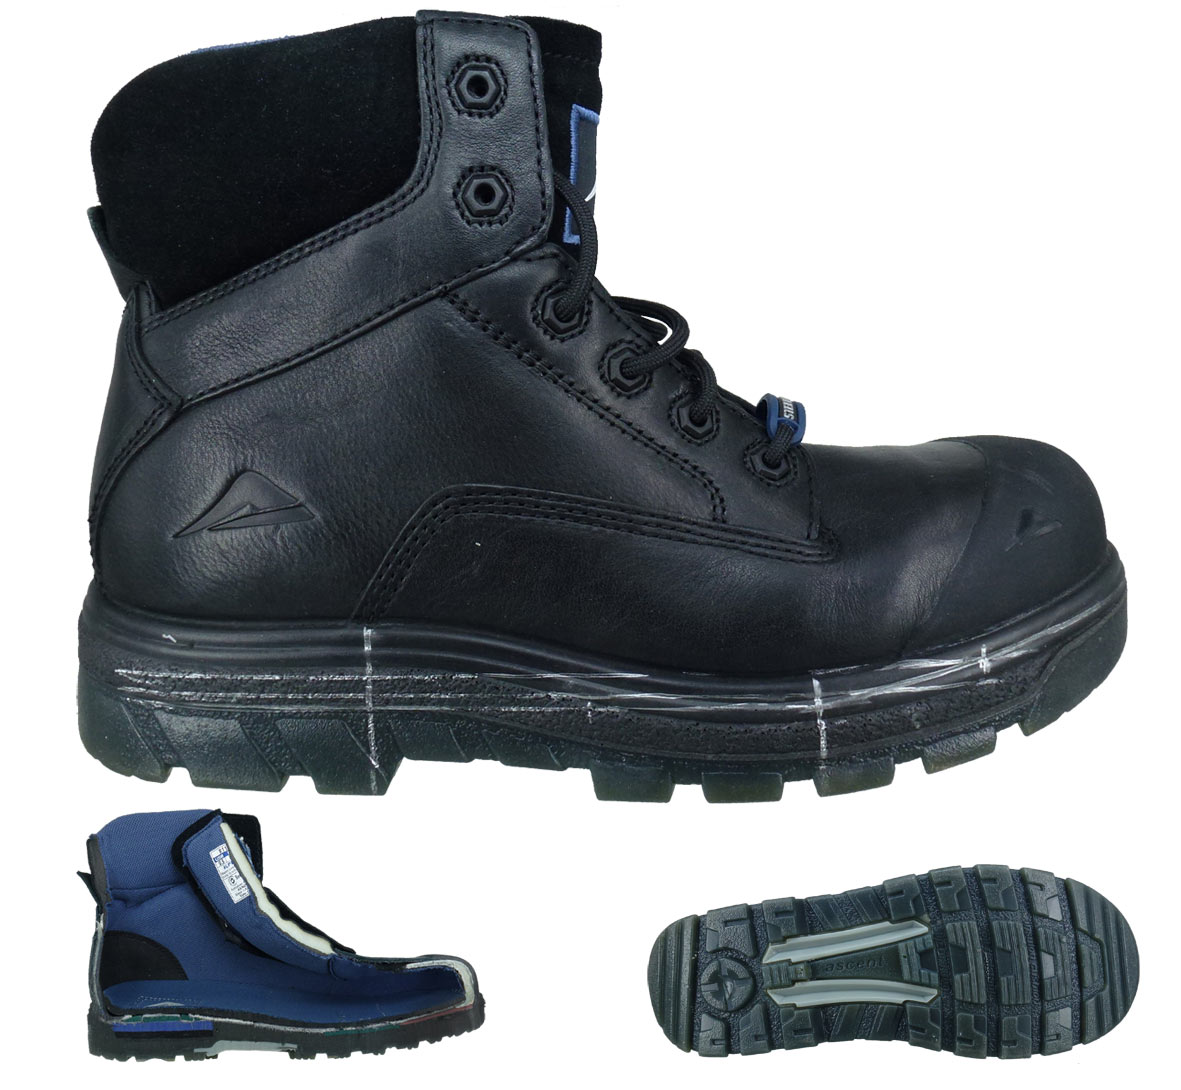
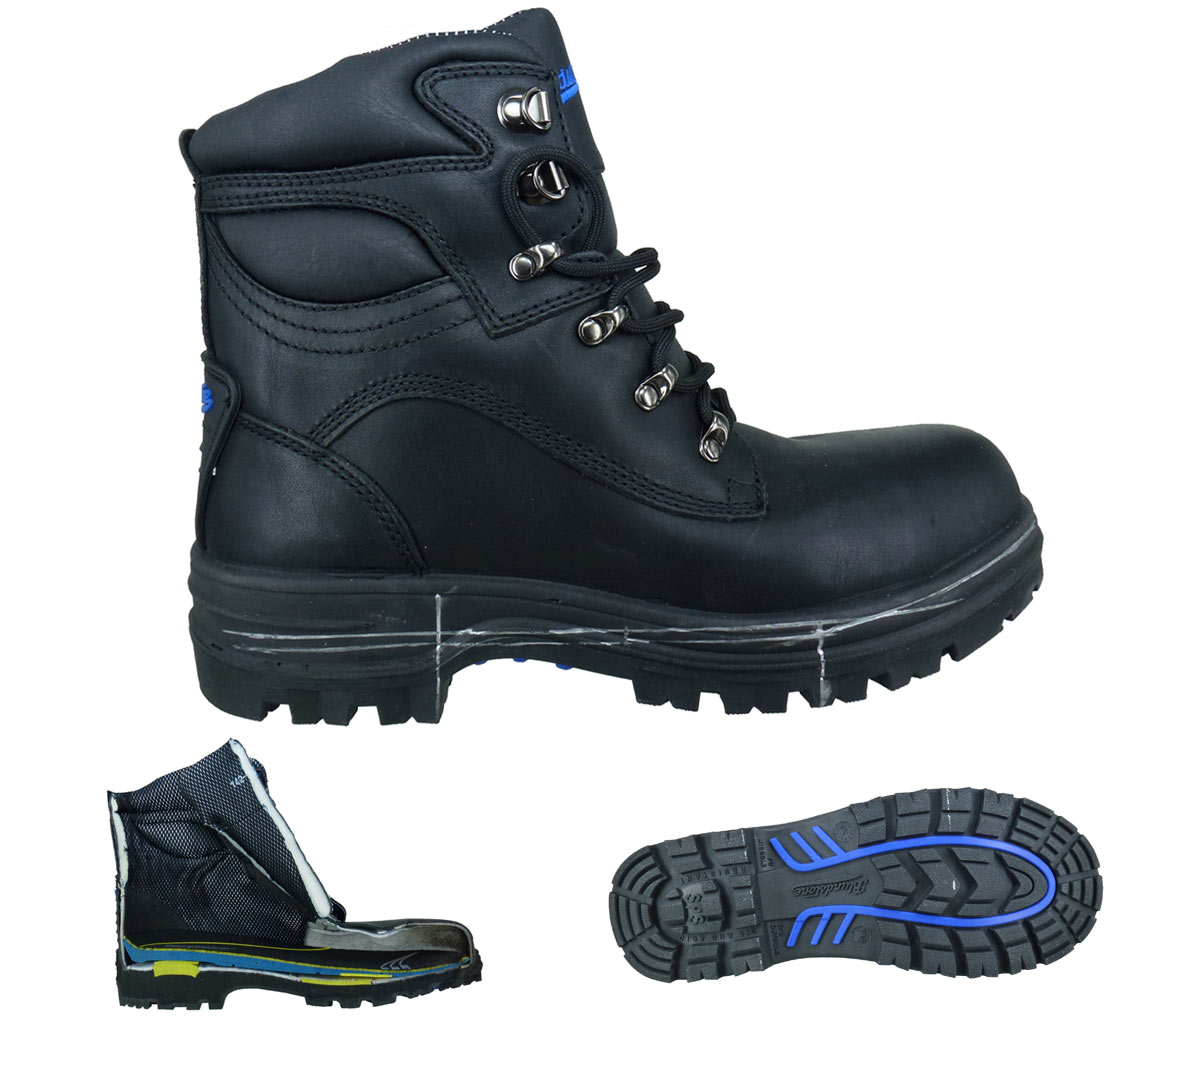
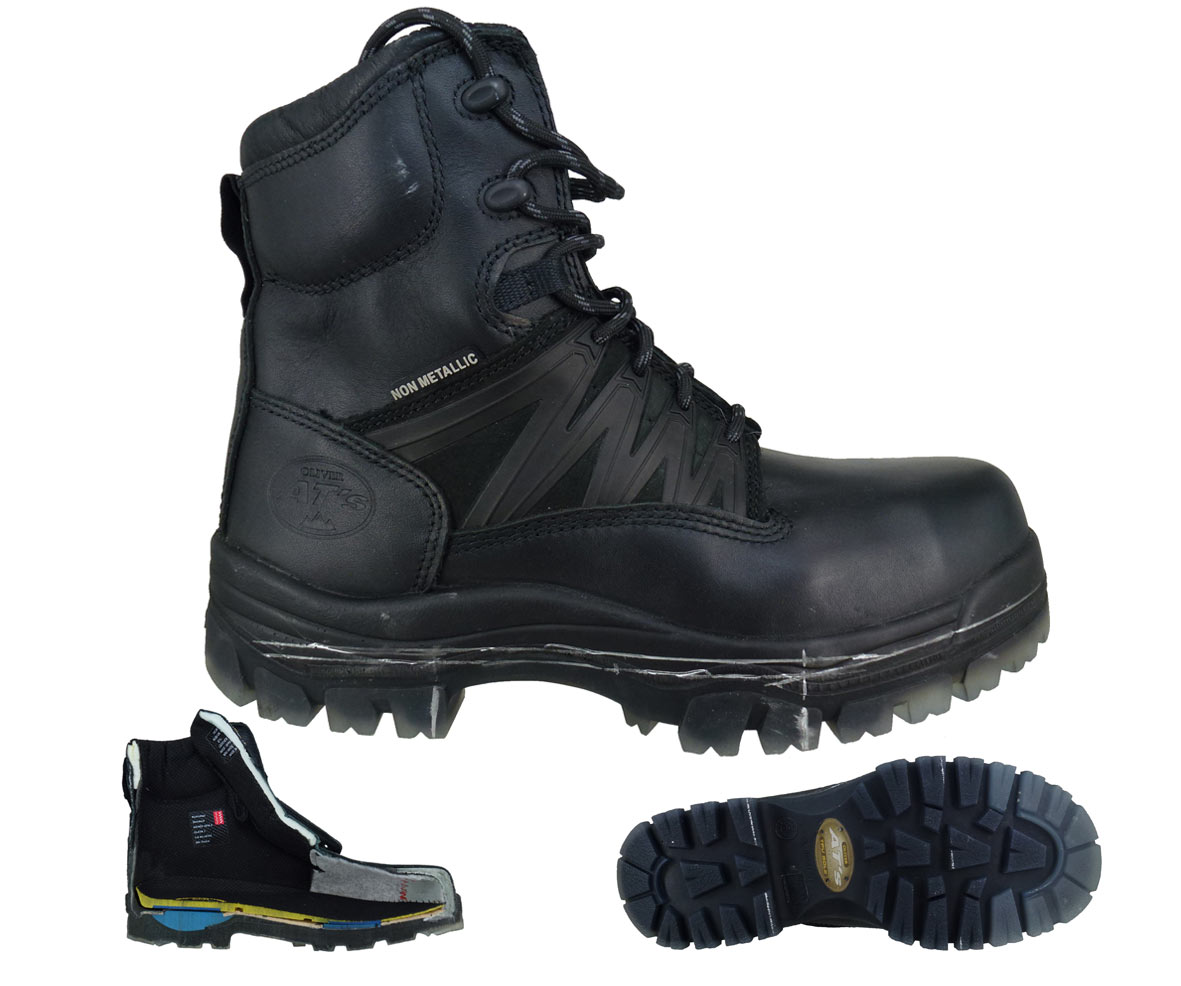
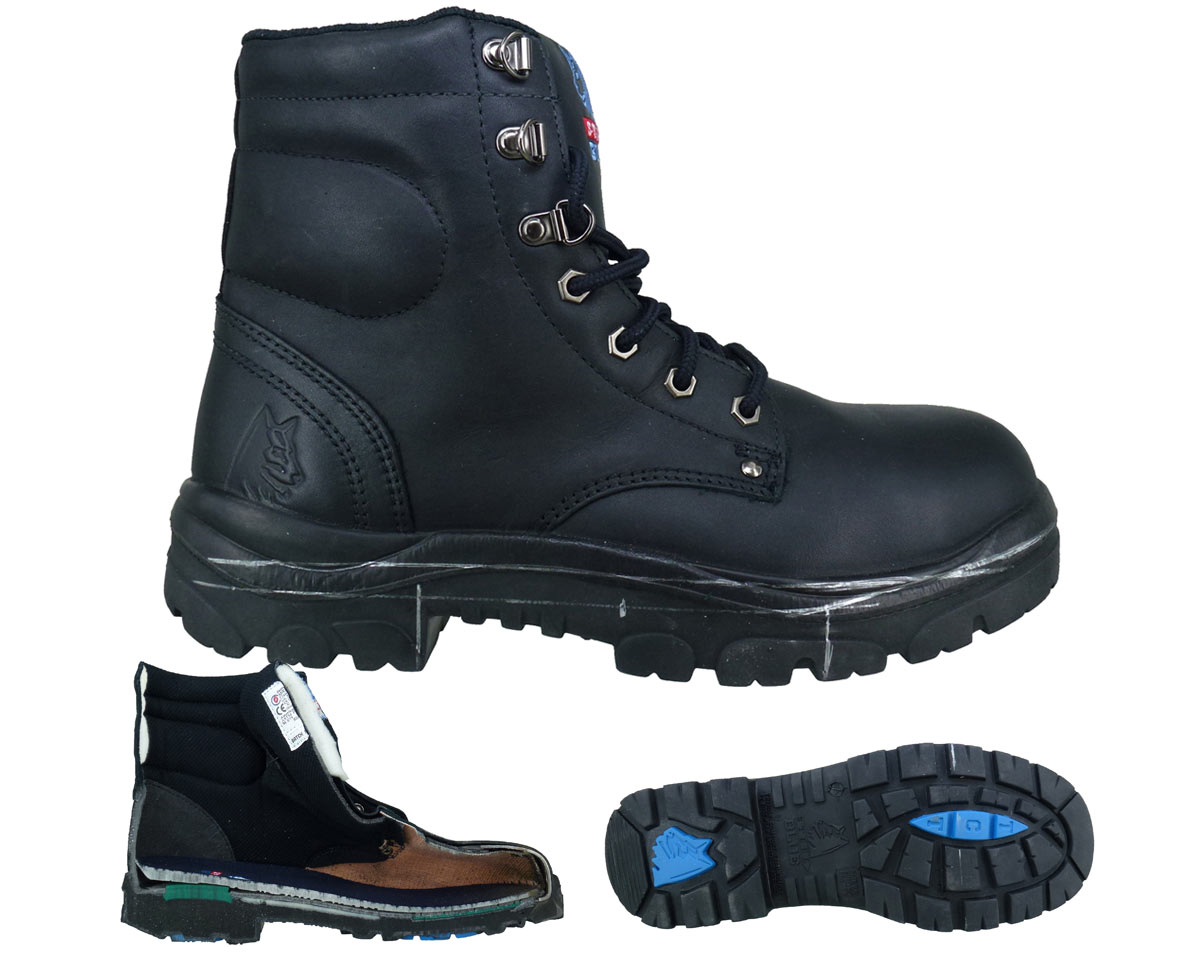
Although traditionally made of steel, composite materials including plastics and aluminium are also commonly used in today’s workboots. Regardless of what material the manufacturer decides to use in their safety workboots, that material must be put through the same AS/NZ standards to be sold in this market as a safety workboot. This study has been conducted to research biomechanical features of safety boots that contribute to the prevention of injury apart from the AS/NZ standard." The boots included in this study were commonly available in the Australian market at the time of the study (2011), utilised a common manufacturing method (direct injection outsole) and had common sole materials (PU midsole, TPU outsole).Table Boots selected for test
Safety Boot Group |
||
Manufacturer |
Model |
Size (UK) |
Ascent |
8.5 |
|
Blundstone |
8.5 |
|
Oliver |
8.5 |
|
Steel Blue |
8.5 |
|
Steel Blue |
8.5 |
|
Preparation of shoe prior to testing
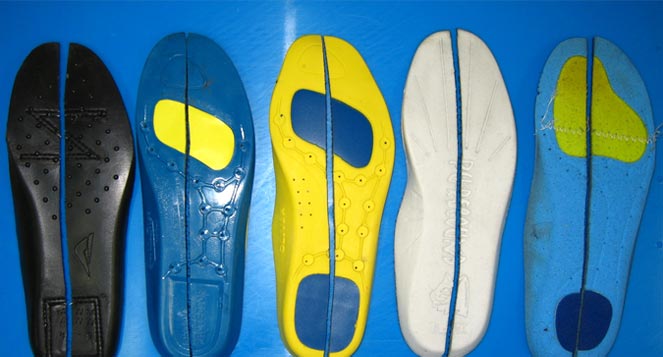
The right boot of each pair was selected for testing and the left boot was cut lengthwise so that the materials and methods of construction could be inspected. On the sectioned boot, the construction characteristics of the heel, forefoot and protective toecap were examined, and the thickness and hardness of the sole in the heel and forefoot regions were measured.
The left boot and insole were sectioned along a line approximately through the centre of the heel and forefoot (determined from the midpoints of the outsole at the widest parts of the heel and forefoot), figure 1. For some boots the saw cut was placed lateral to the line to access construction components or avoid steel shanks.
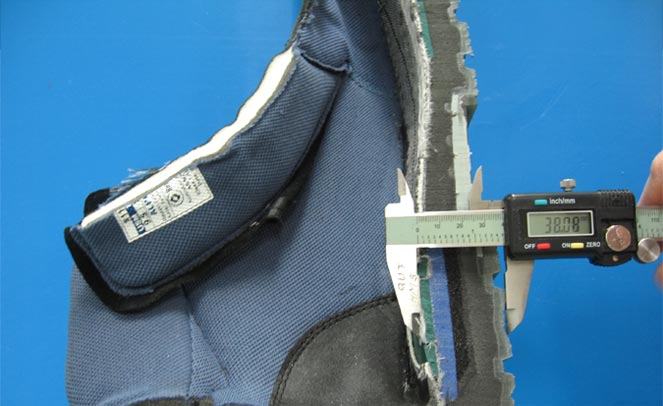
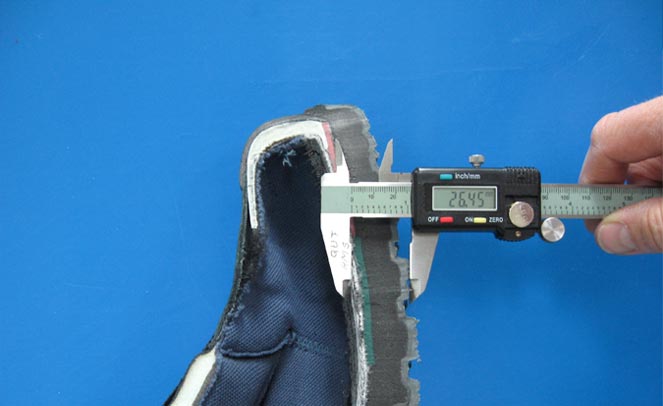
The thickness of the sole in the heel and forefoot regions was measured with a
digital calliper, figure 2 & 3.
The hardness of the heel and forefoot sections were measured with a TECLOCK GS-701 gauge and estimates (Shore hardness C) derived from at least three readings in each region.
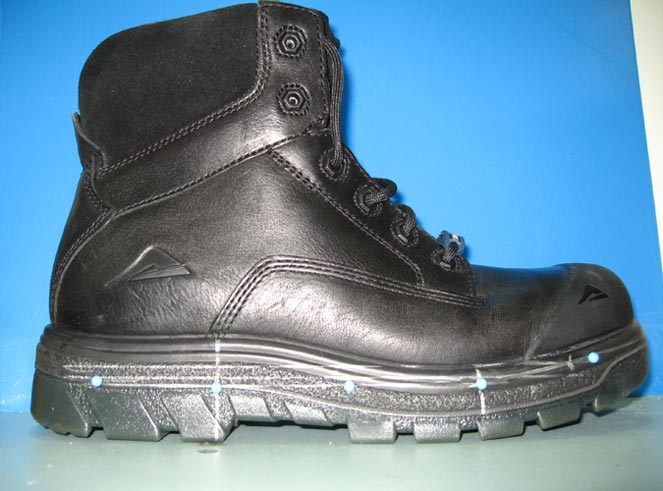
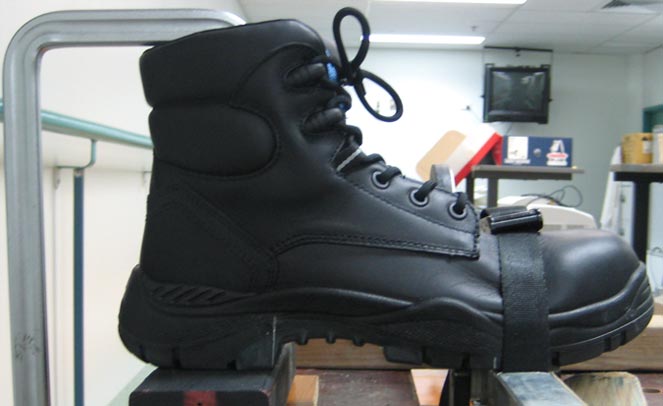
Prior to testing, each right boot was measured and the location of the leading edge of the heel determined as a proportion of the overall length. On average, for the group of 5 boots, the leading edge of the heel was found to be located at approximately 30% of the total length, measured from the rear of the outer sole. In a similar way, the location of the forefoot flex region was determined to be at about 69% of the total length, figure 4. In general, the 69% mark aligned well with the curvature of the outsole at the start of the toe-spring, supporting the decision to use this division for the purpose of testing.
Overall, the values of 30% and 69% were considered to best represent the average for the group and were therefore used to mark the boots prior to testing. The length-marks were subsequently used to position the boot precisely on each test rig thereby ensuring maximum consistency throughout the tests.
In addition to the lengthwise divisions, the side of the sole was marked with two lines. The first was horizontal, parallel to the supporting surface, and crossed from the heel to the forefoot flex region. The second was parallel to the inherent toe-spring of the boot, following the general line of the forefoot region, figure 4. These lines were used as references for measuring angular deviations when the boot was subjected to bending.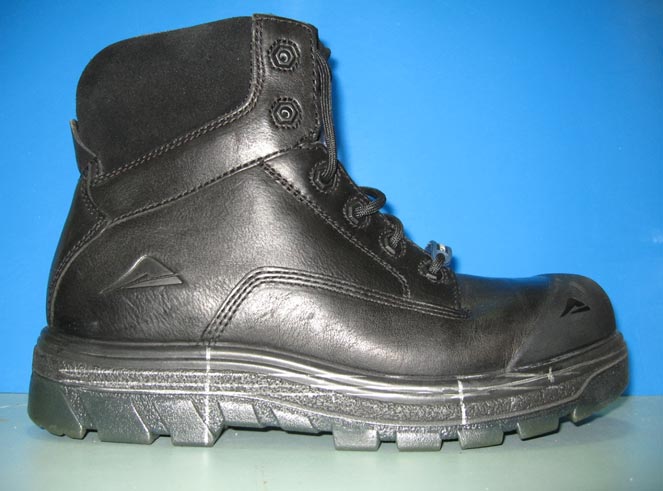
Midsole Bend test
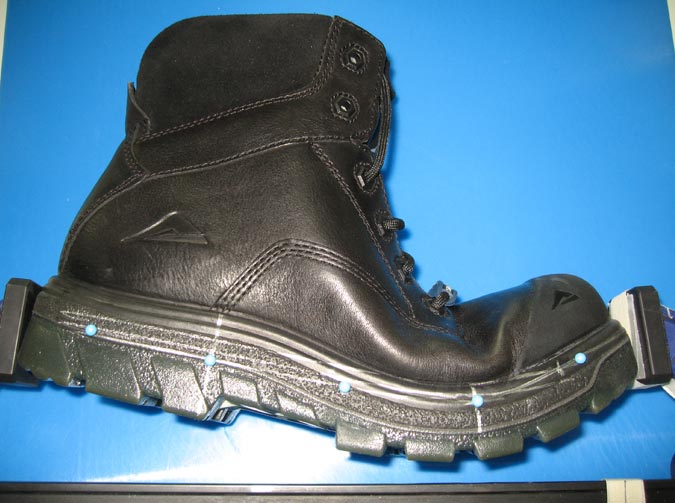
The midsole bend test was undertaken to determine whether an otherwise unconstrained boot would bend primarily at the forefoot flex region when subjected to a longitudinal compressive load, or whether significant amounts of bending would occur at other regions, such as the midfoot. Pins were inserted into the medial aspect of sole, along the lines that had been previously marked on each boot, figure 5.
The boot was positioned in a compression clamp and loaded to produce a shortening of about 5% in overall length. Significant bending could be observed and the boot was then photographed. Two angles were subsequently measured from the photograph. These represented the bends between the heel and midfoot (angle A in figure 6), and the midfoot and the forefoot (angle B in figure 6). flex angles 1 and 2 respectively. The magnitudes of the angles are reported along with the total bend angle, and are also expressed as a percentage of the total to allow comparison between boots.
Forefoot Flex test
The forefoot flex test was undertaken to determine the stiffness of the boot in the flex region of the forefoot. Generally, the flex region in the forefoot of the boot aligns approximately with an arc running through the metatarsophalangeal joints of the foot. This region of the boot flexes during the latter part of the stance phase as the heel rises from the ground.
A rig was constructed with a hinge mechanism in such a way that force could be applied to the outer sole of the forefoot of the boot while the heel and midfoot sections were clamped, via a steel plate, to prevent motion, figure 7.
The boot was positioned in the rig so that the hinge was aligned with the region of metatarsal flex (69% length mark of the boot). Torque, centred at the axis of the hinge mechanism, was applied to the boot via a lever. The magnitude of the applied torque was determined as force x distance, where the force was measured by a load cell and the distance was the distance from the hinge to a set point along the lever. Torque was recorded at three flex positions, 5°, 10°, and 15°, with the start position (0°) being the inherent toe spring formed at manufacture.
Midsole Torque test
The midsole torque test was undertaken to determine the torsional stiffness of the middle section of the boot between the front edge of the heel and the metatarsal break (30%-69% marks).
The boot was constrained on the rig using a clamp in a similar manner to the forefoot flex test but the internal loading mechanism only extended to the leading edge of the heel (30% mark), figure 8. The rig had a rotatable platform on which the forefoot of the boot could be constrained by means of an adjustable strap, figures 8.
Collapse of the toe box was not a problem in this series of tests because of the rigid toecaps that were incorporated in the boots.
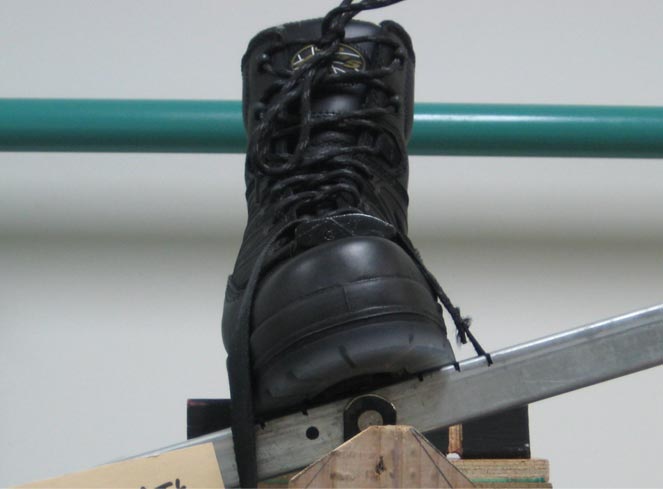
The boot was positioned in the rig so that the axis of rotation was aligned with the central long axis of the boot, while the rear edge of the platform was aligned with the 69% length mark. Torque, centred at the axis of the platform, was applied to the boot via a lever extending from the platform, figures 9 & 10.
The magnitude of the applied torque was determined in a similar manner to the forefoot flex test (force x distance, where the force was measured by a load cell and the distance was the distance from the hinge to a set point along the lever). Torque was recorded at three positions; 5o, 10o, and 15o. The boot was only subjected to torques that inverted the forefoot.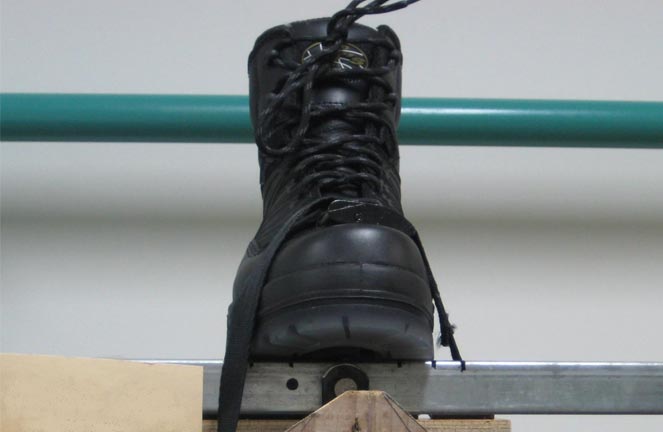
Heel Counter Stiffness test
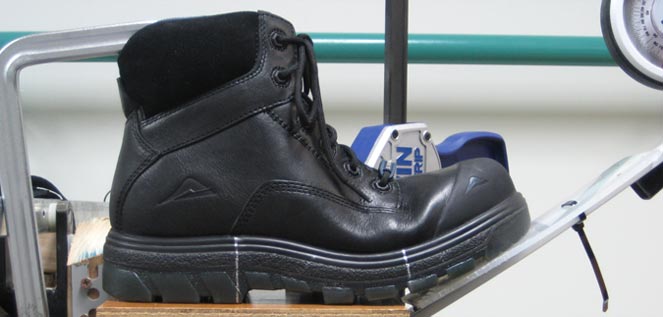
The heel counter stiffness test was undertaken to determine the stiffness of the heel counter when subjected to a force applied to its rear.
A rig was constructed such that a localised force could be applied to the heel counter via a circular, soft faced, indenter (contact area = 1 cm2) attached to a load cell. The boot was constrained from moving by a clamp that exerted a distributed load through the forefoot, midsection and heel. Horizontal load, parallel to the supporting surface of the heel, was applied to the external surface of the counter. The indenter was positioned 25mm above the interior height of the heel seat for boots, figure 11.
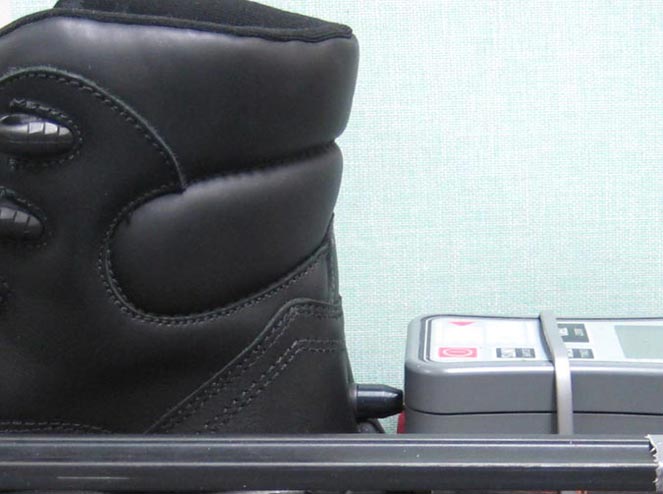
The counter was step-loaded (five sequential, discrete increments, each of approximately 3.8mm) until a horizontal displacement of approximately 19 mm was reached. The linear displacement and force were recorded for each increment.
Results
The construction details, thickness and hardness of the heel and forefoot are given in table 2.
Table 2 General construction characteristics: Safety Boot Group
HT = Heel thickness (mm), FT = Forefoot thickness (mm), HH = Heel hardness, FH = Forefoot hardness. Hardness: Shore C durometer.
Safety Boot Group |
|||||||||
Manufacturer and Model |
Lasting method |
Shank |
Heel construction | Forefoot construction | Toecap construction | HT (mm) |
FT (mm) |
HH Shore |
FH Shore |
slip |
plastic |
Layered foam insert |
foam insert | plastic | 38 |
26 |
35 |
40 |
|
board |
steel |
Layered foam insert |
foam insert | steel | 36 |
23 |
45 |
45 |
|
board |
plastic |
Reverse foam dome |
foam insert | plastic | 35 |
25 |
35 |
45 |
|
board |
plastic |
Layered foam insert |
foam insert | steel | 36 |
22 |
40 |
45 |
|
board |
plastic |
Layered foam insert |
foam insert | plastic | 32 |
18 |
40 |
45 |
|
Midsole Bend test
The mean overall bend for the Safety Boot group was 24°, and the range was 20° to 30°. The mean bend in the midfoot and metatarsal flex regions was approximately 15.5% and 84.5%, respectively.
Midsole bend graphs for the Safety Boot group are shown in figures 12 & 13. Figure 12 indicates the respective angles in degrees and shows the total bend for each boot. Figure 13 indicates the relative bend at the midfoot and forefoot as percentages of the total bend.
Forefoot Flex test
For the Safety Boot group at 15° of flexion the mean torque was 9.4 Nm, and the range was 6.5 Nm to 12.7 Nm.
A forefoot flex stiffness graph for the Safety Boot group is shown in figure 14.
Midsole Torque test
For the Safety Boot group at 15° of twist the mean torque was 12.2Nm, and the range was 9.5Nm to 16.9Nm.
A midsole torque stiffness graph for the Safety Boot is shown in figure 15.
Heel Counter Stiffness test
For the Safety Boot group, the mean peak force required to displace the heel counter approximately 14mm was 112N, and the range was 72.5N to 168.3N.
A heel counter stiffness graph for the Safety Boot group is shown in figure 16.
Summary
Midsole bend
The greatest total bend was observed, almost equally, in the Blundstone 142 and the Steel Blue Arglye, 30° and 28°, respectively. The least bend was observed, almost equally, in the Oliver AT 45645 and the Ascent Alpha, 20° and 21°, respectively. No boot demonstrated a substantial bend in the midfoot region, the greatest being the Steel Blue Argyle and the Blundstone 142 with 6° and 5°, respectively.
The least midfoot motion was observed in the Steel Blue Canberra which demonstrated only 1o of bend, possibly because of the external midfoot reinforcement structure that is incorporated in the boot. All boots flexed predominantly at the metatarsal region which, on average, accounted for approximately 85% of the total bend.
Forefoot flex
The stiffest boots (Ascent Alpha and Oliver AT 45645) were, on average, about 1.3x stiffer than the group mean and 1.9x stiffer than the least stiff boots (Blundstone 142 and Steel Blue Argyle).
Midsole torque
The stiffest boot (Ascent Alpha) was, on average, about 1.4x stiffer than the group mean and 1.8x stiffer than the least stiff boot . For the Senior group, the stiffest boot was, on average, about 1.3x stiffer than the group mean and 1.9x stiffer than the least stiff boots (Blundstone 142 and Steel Blue Argyle).
Heel counter stiffness
The stiffest boot required, on average, about 1.5x more force to produce equal displacement than the group mean and 2.3x more force than the least stiff boot.
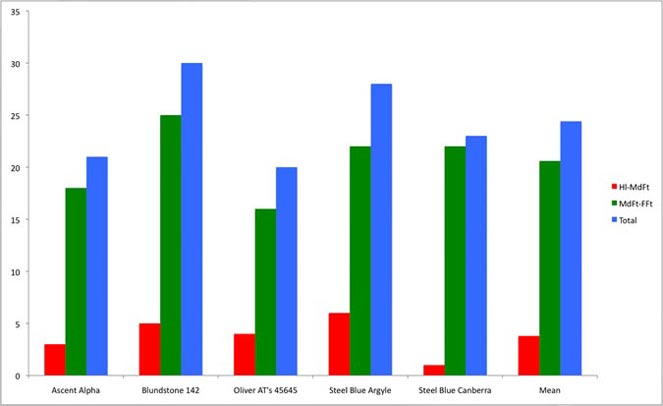
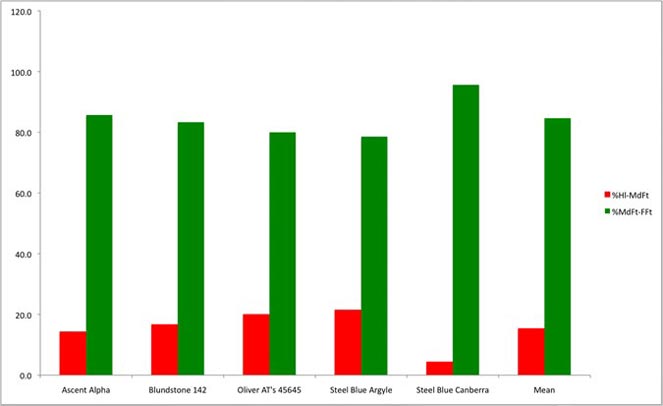
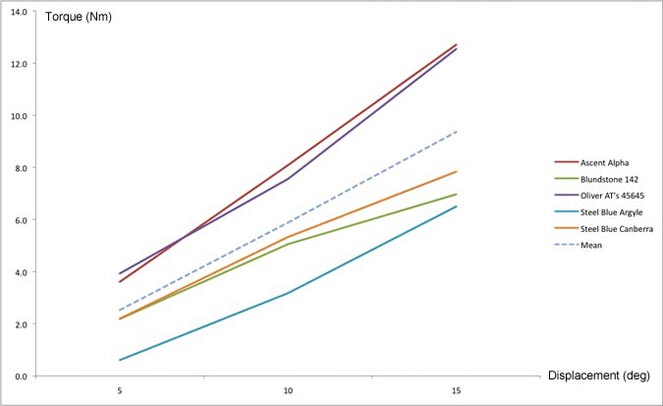
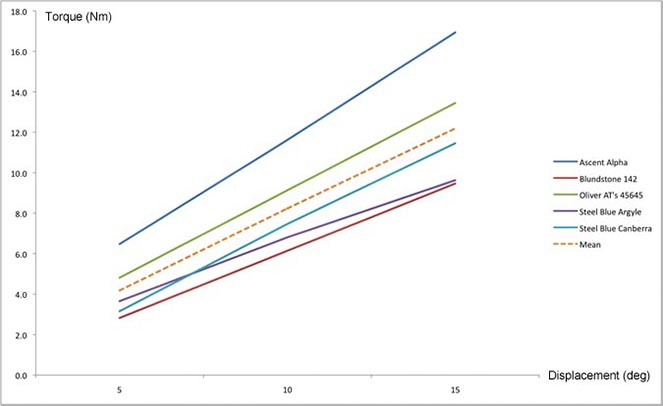
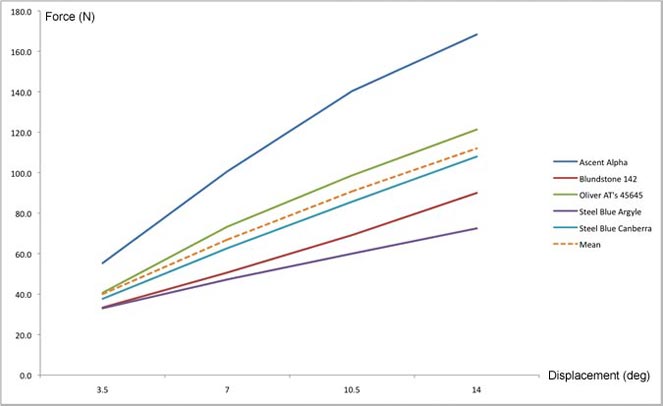
Table 5 Summary of characteristics and findings: Safety boot Group
1. Counter stiffness score and rank: derived as the sum of the scores for the test (quasi area under the curve), highest score considered to indicate stiffest counter and ranked 1, lowest score ranked 7.
2. Forefoot flex score and rank: derived as the sum of the scores for the test (quasi area under the curve), lowest score considered to indicate most flexible metatarsal break and ranked 1, highest score ranked 7.
3. Torsional stiffness score and rank: derived as the sum of the scores for the test (quasi area under the curve), highest score considered to indicate stiffest mid-section and ranked 1, lowest score ranked 7.
Safety Boot Group |
||||||
Manufacturer and Model |
Counter Stiffness Rank |
Forefoot Flex Rank |
Torsional Stiffness Rank | Counter Stiffness Score | Forefoot FLex Score | Torsional Stiffness Score |
1 |
5 |
1 |
464.7 | 24.4 | 35.0 |
|
4 |
2 |
5 |
243.2 | 14.2 | 18.4 |
|
2 |
4 |
2 |
334.0 | 24.0 | 27.4 |
|
5 |
1 |
4 |
212.8 | 10.3 | 20.1 |
|
3 |
3 |
3 |
294.0 | 15.3 | 22.1 |
|
Background
Report commissioned by Dominion Cross Pty Ltd for the purpose of objective third party testing of key safety boot styles on the Australian market using an injected PU/TPU outsole construction.