
INDEX
1. INTRODUCTION
2. PREPARATION OF SHOE PRIOR TO TESTING
3. MIDSOLE BEND TEST METHODOLOGY
4. FOREFOOT FLEX TEST METHODOLOGY
5. MIDSOLE TORQUE TEST METHODOLOGY
6. HEEL COUNTER STIFFNESS TEST METHODOLOGY
7. RESULTS
8. RESULTS SUMMARY TABLE - YOUTH GROUP
9. RESULTS SUMMARY TABLE - SENIOR GROUP
Introduction
Faced with the task of purchasing shoes, consumers often seek information and advice from health care professionals, retailers and shoe manufacturers regarding the fit, general features, quality and overall appropriateness of commercially available footwear. With regard to school shoes, collated data has been made publicly available previously (School Shoe Report1), but while the shoes were evaluated in a systematic manner the assessments were subjective. Footwear evaluation tools used in research are similarly subjective even though the assessment process is more extensive, being based on multiple characteristics of the shoes 2,3. While these approaches are simple and reliable, they are not quantitative and may lack the ability to discriminate between models that appear subjectively similar.
Quantitative studies have been undertaken previously but on a small scale because of their dependence on expensive material testing machines or sophisticated research equipment 4,5. If simple test rigs can provide data with sufficient precision to differentiate between shoes, then objective, large-scale quantitative tests could be conducted regularly in order to satisfy the increasing demand for information.
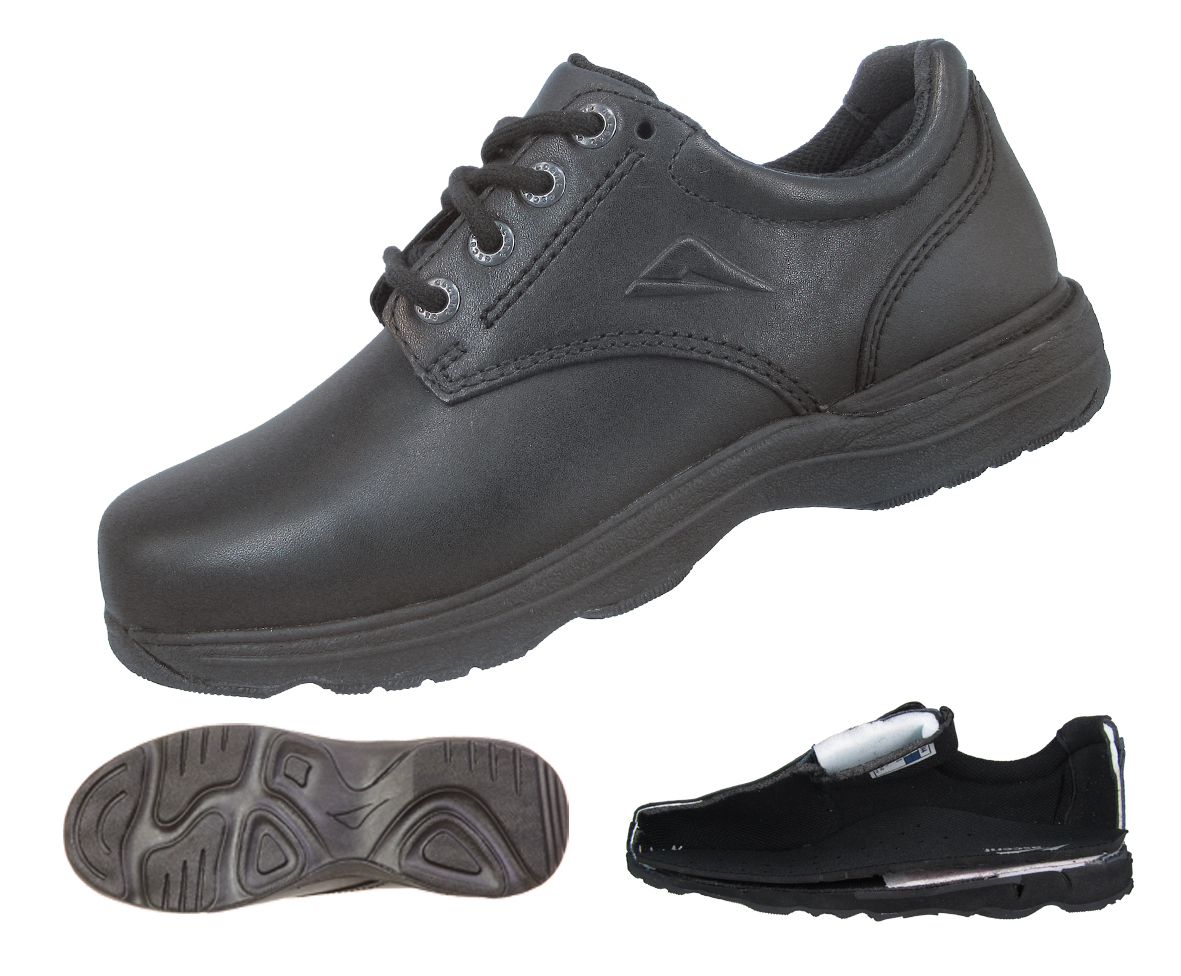
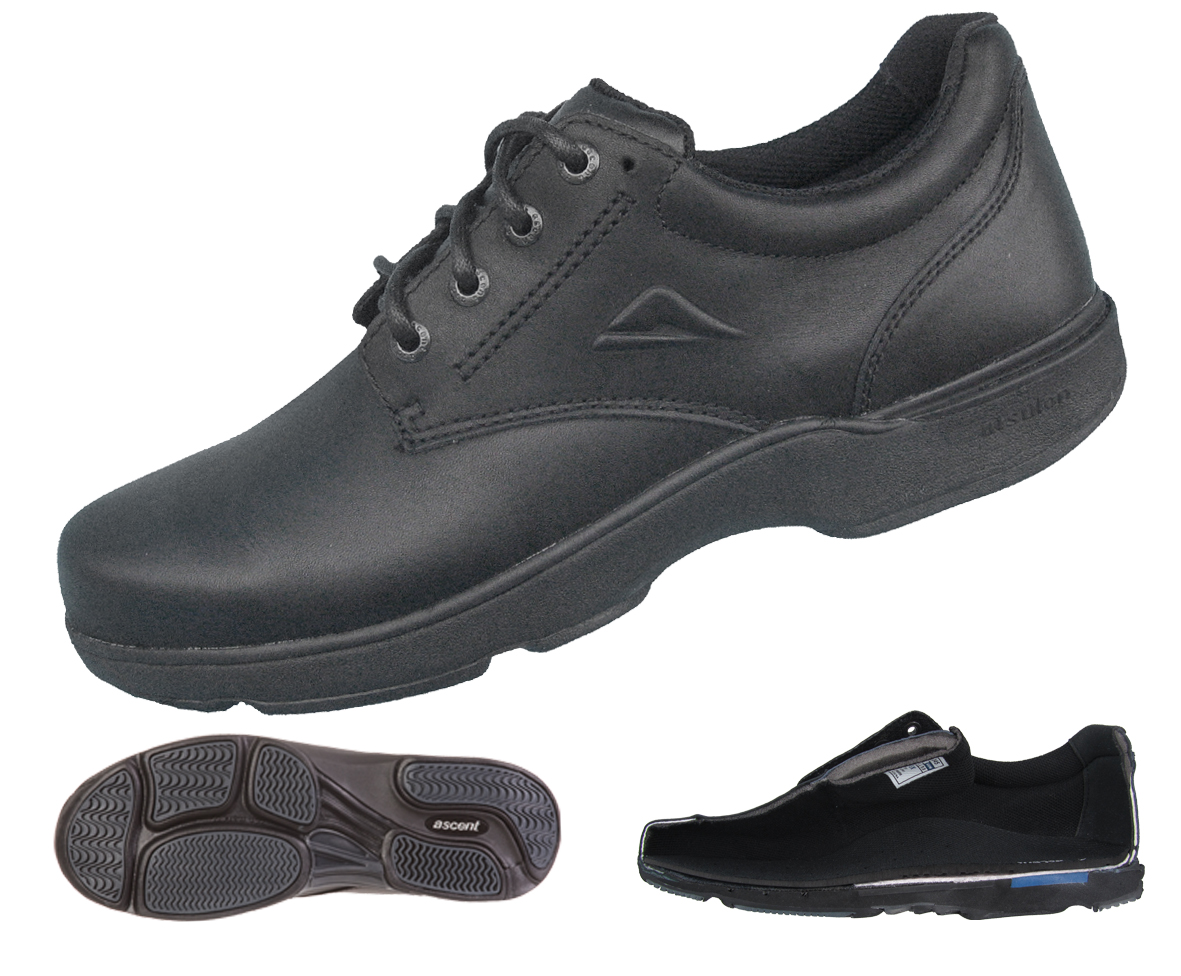
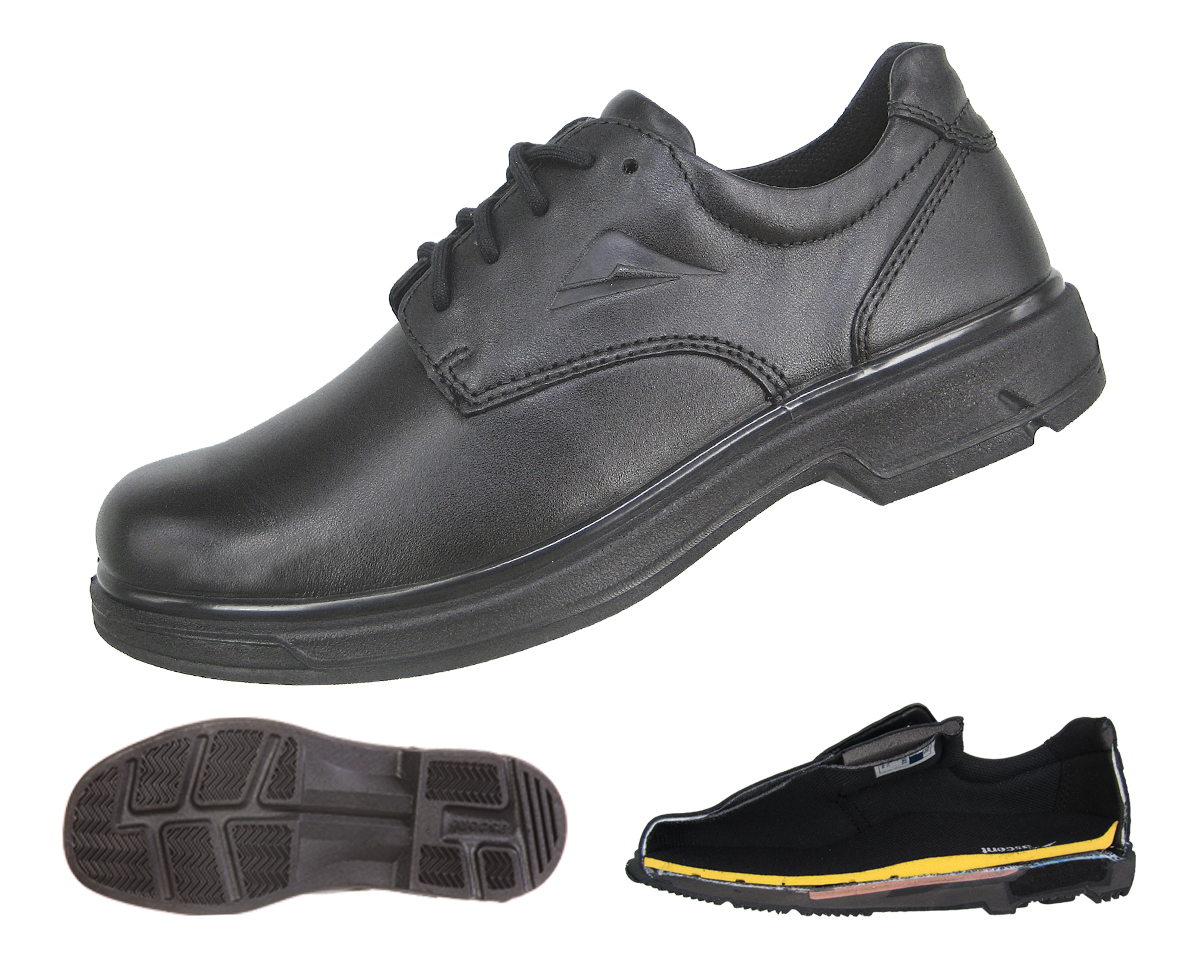
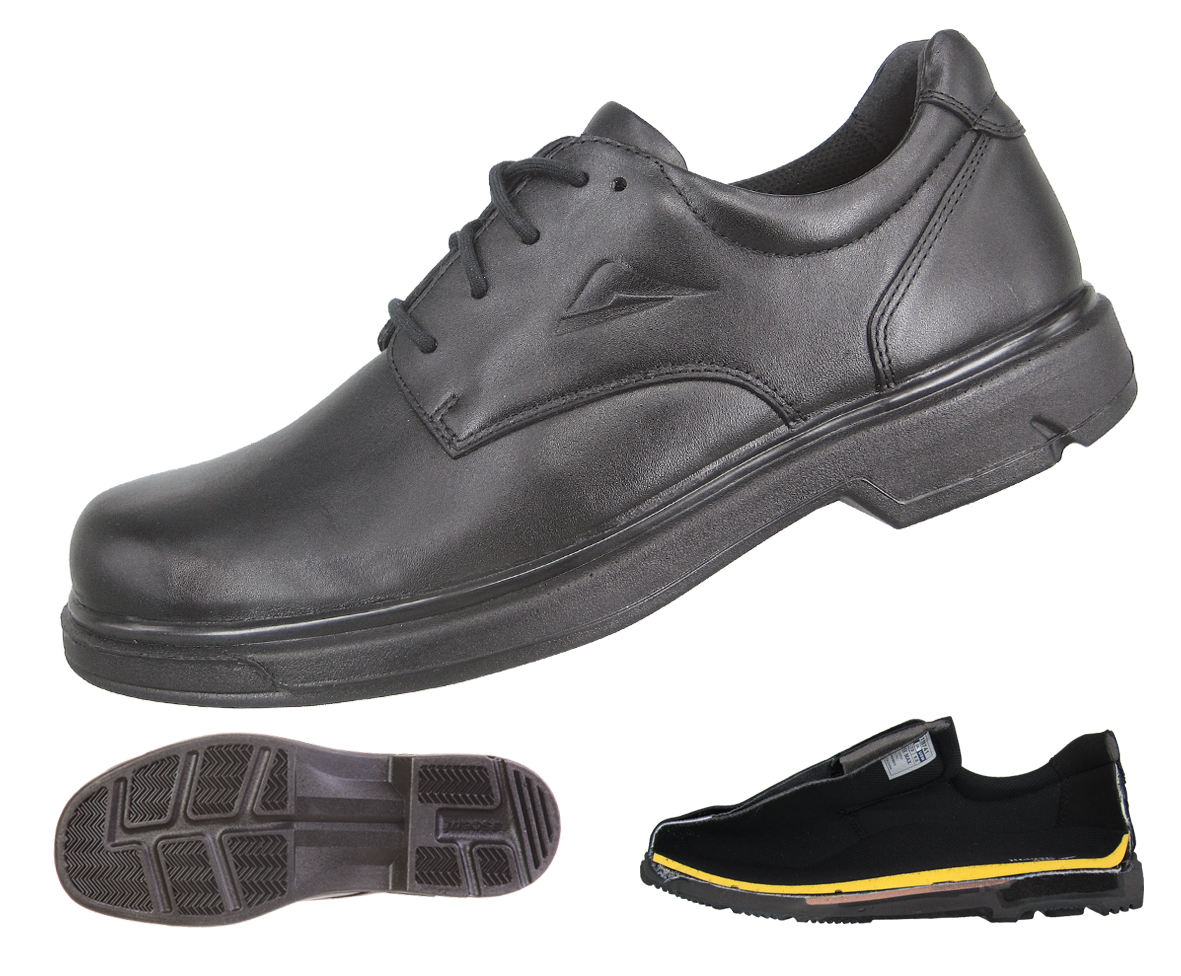
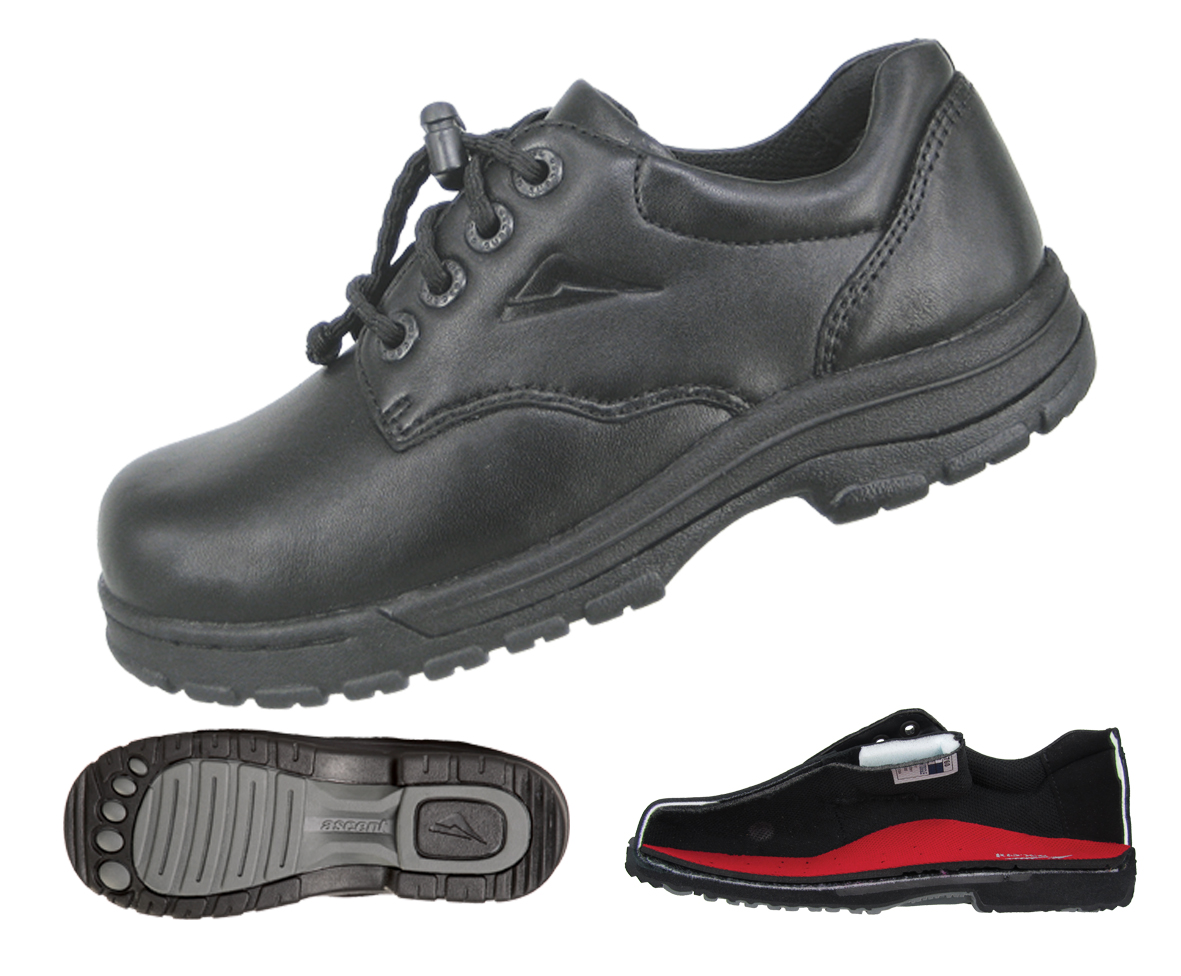
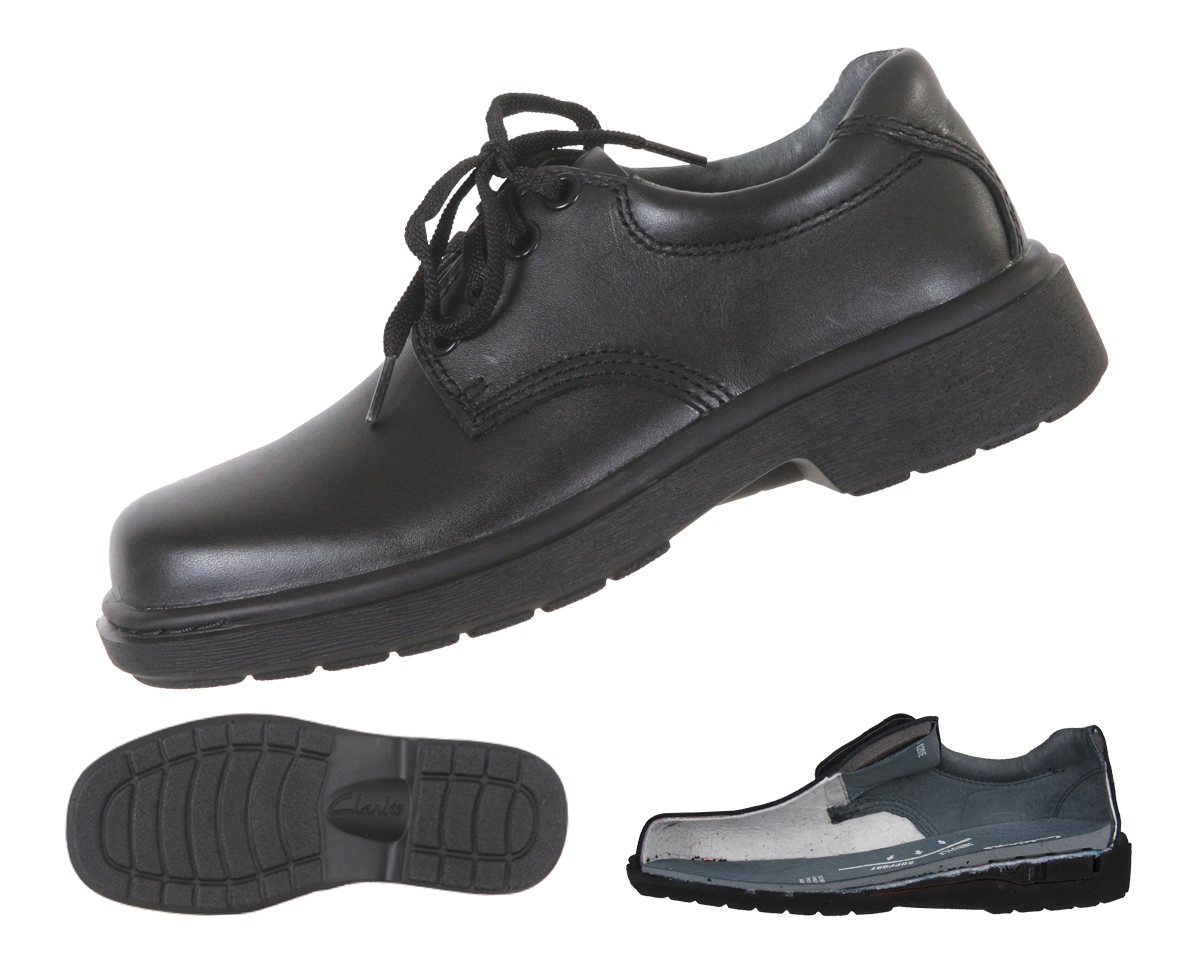
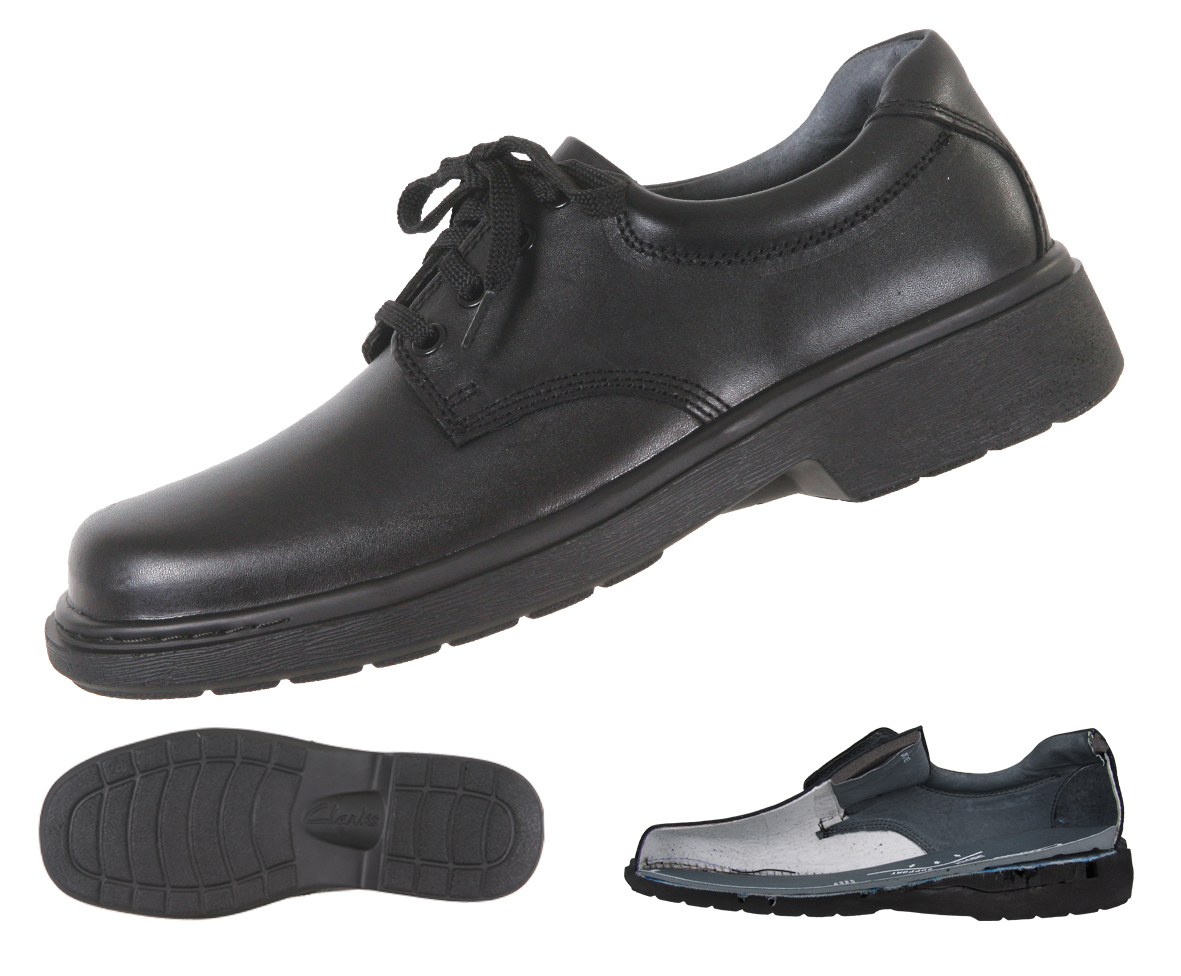
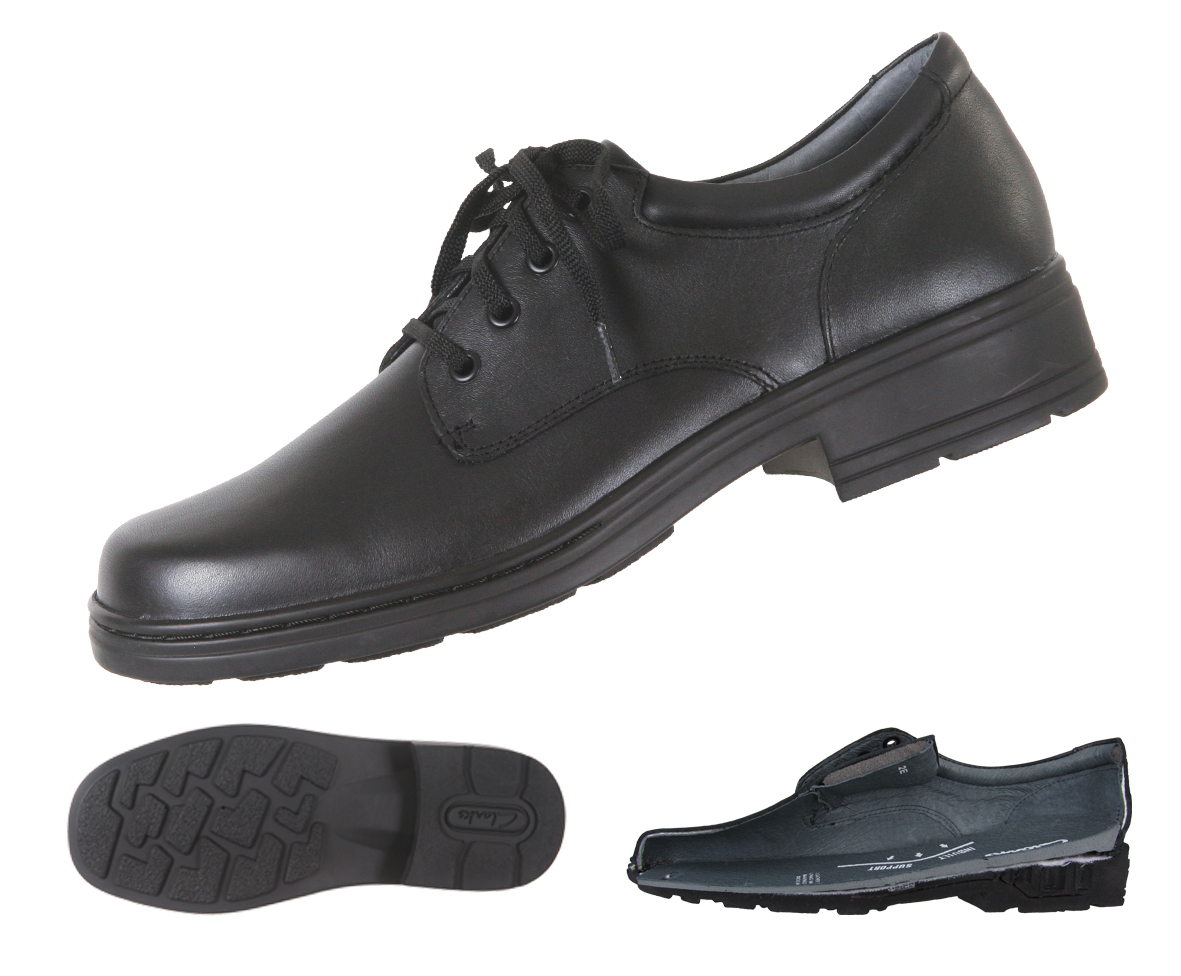
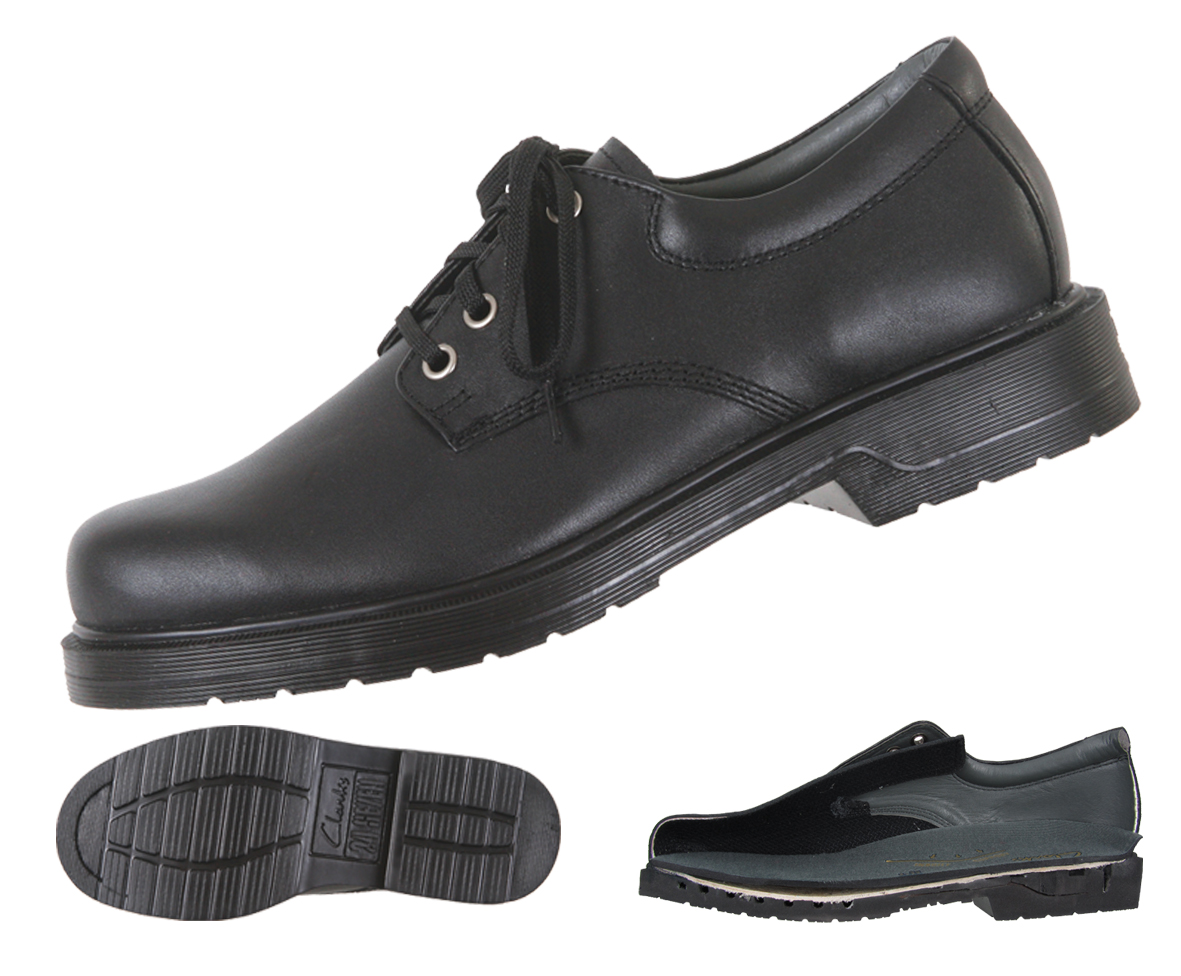
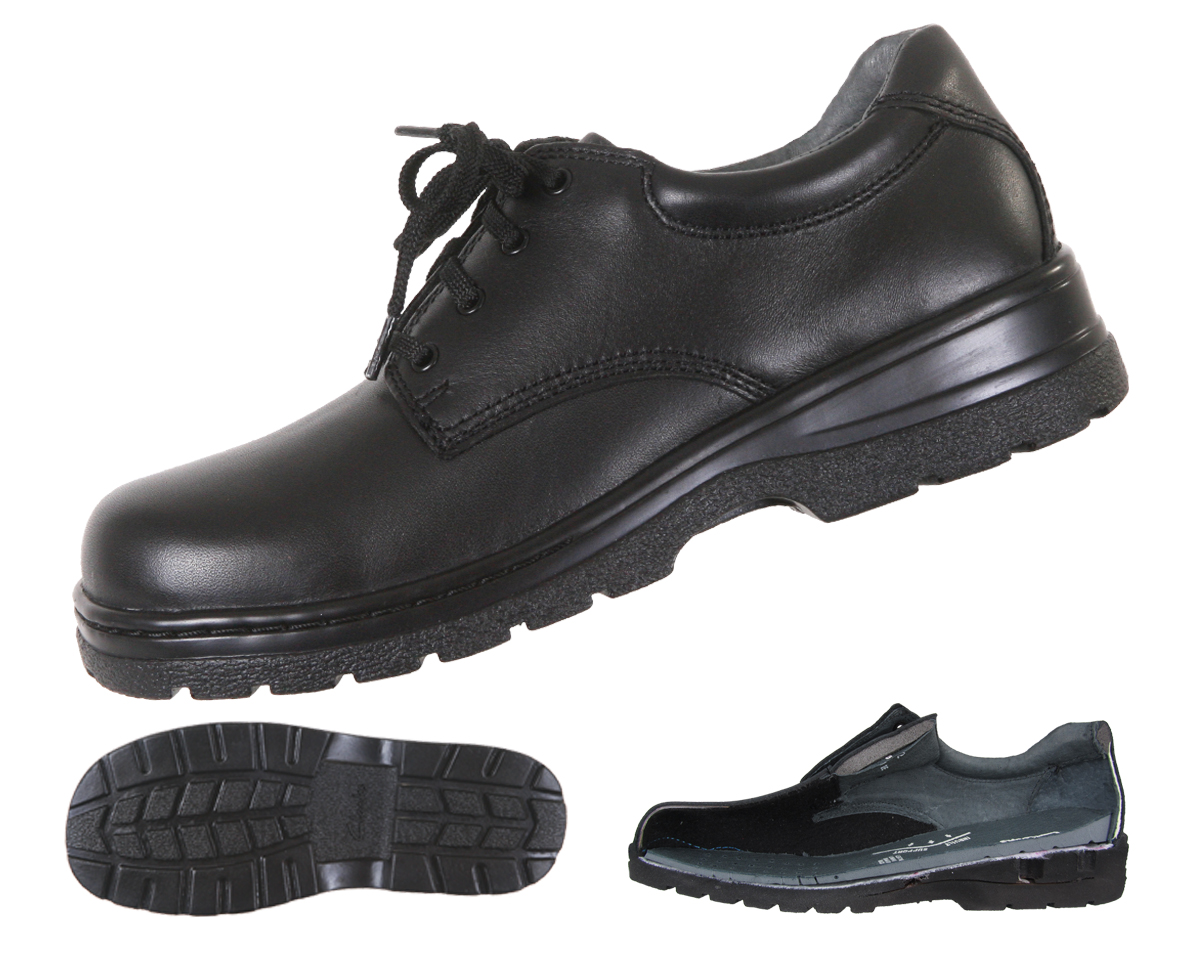
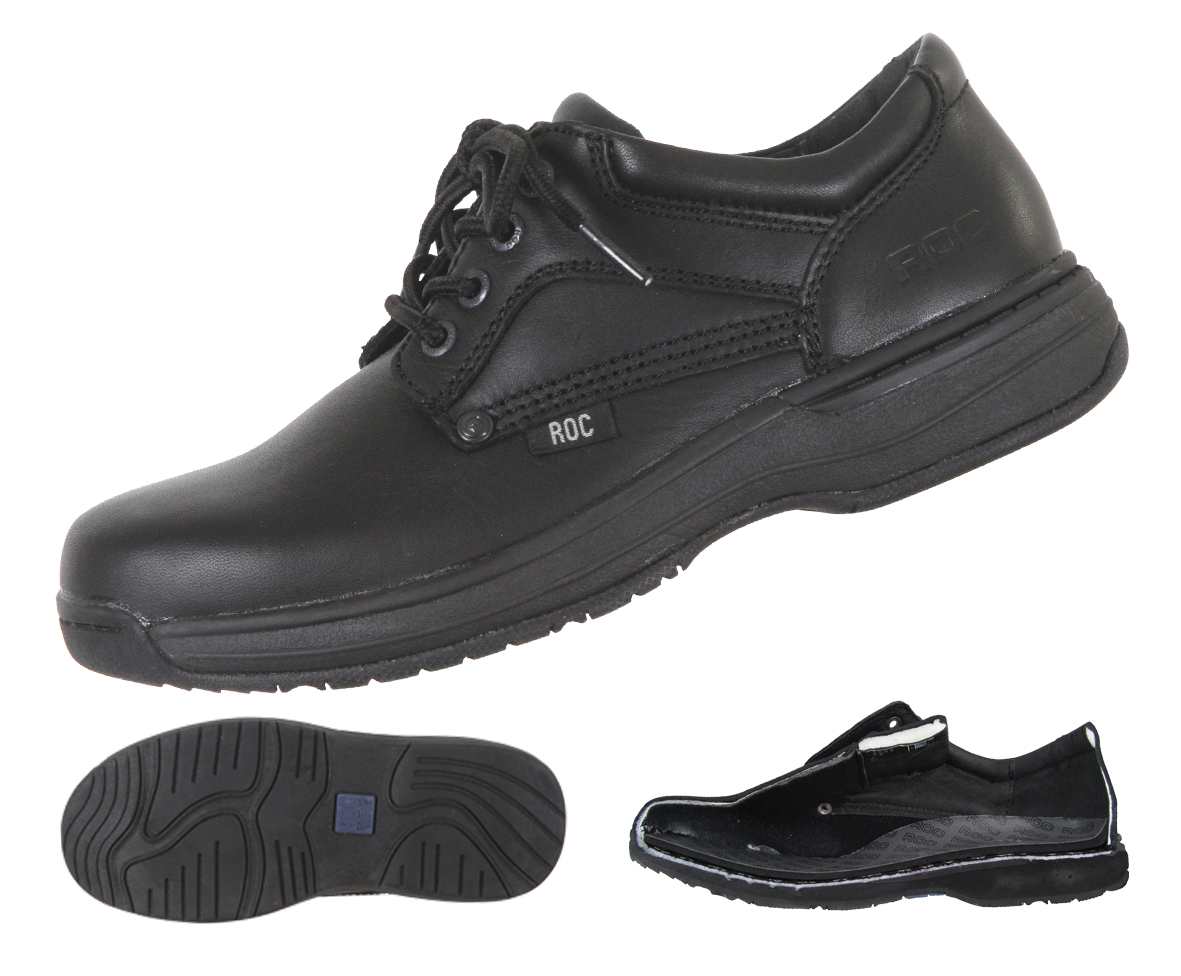
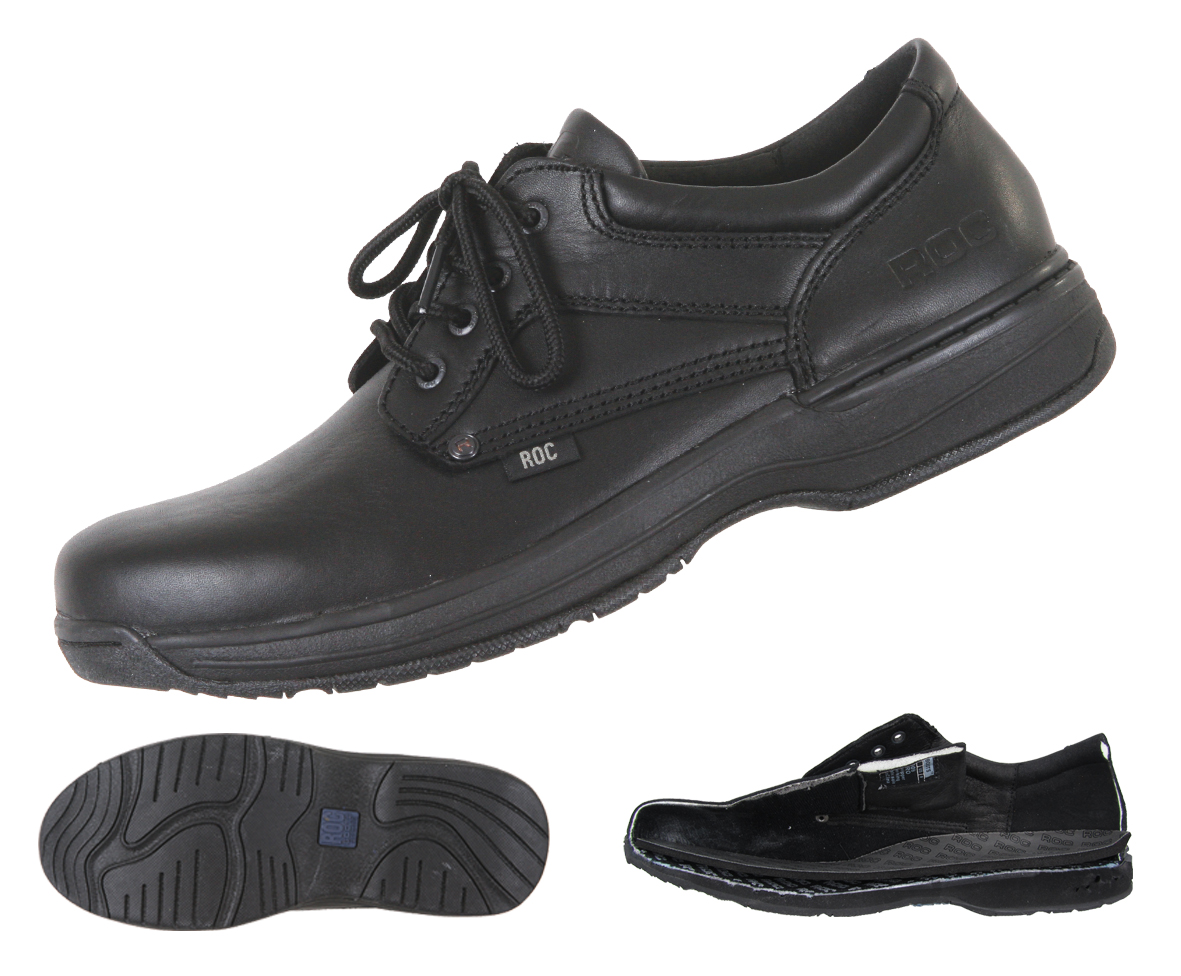
For this study, simple rigs were designed and constructed and characteristics of fifteen models of school shoes from three manufacturers were determined.
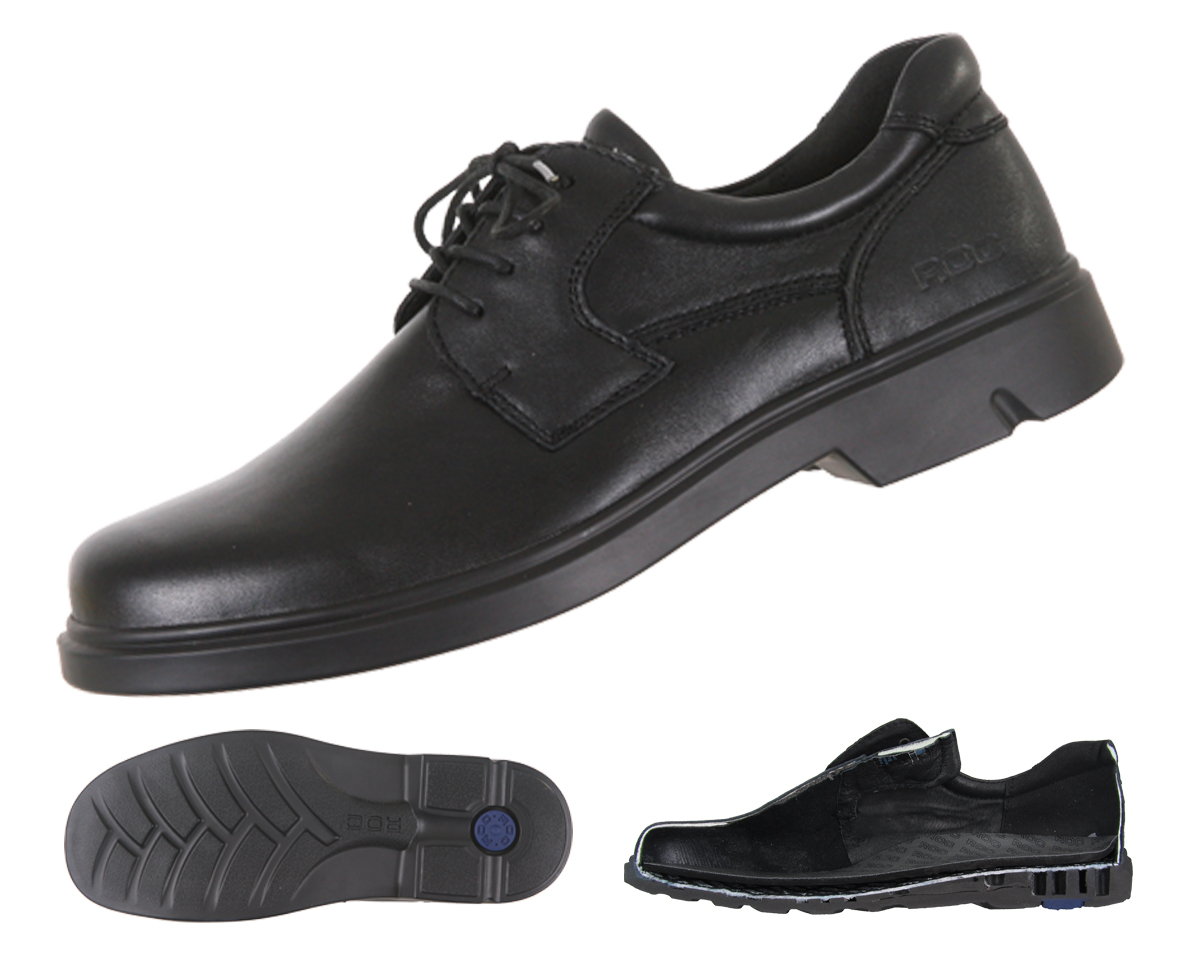
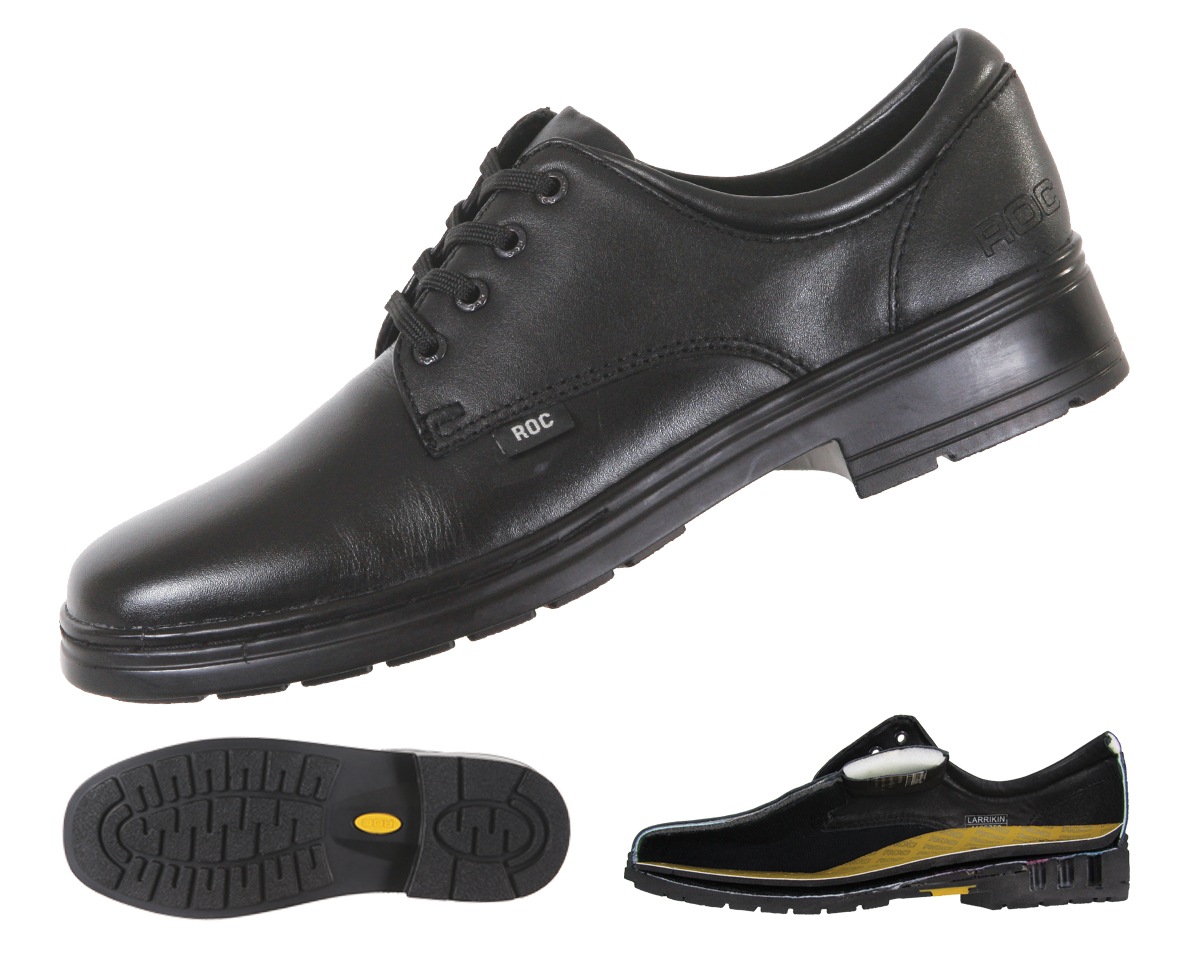
General shoe description
The shoes included in this study were subdivided into two groups, Youth and Senior, and are listed in table 1.
|
Youth Group |
Senior Group |
||
Manufacturer |
Model |
Size (UK) |
Model |
Size (UK) |
Ascent |
2 |
7 |
||
Ascent |
2 |
7 |
||
Ascent |
2 |
7 |
||
Clarks |
2 |
7 |
||
Clarks |
2 |
7 |
||
Clarks |
2 |
|
|
|
Roc |
2 |
7.5* |
||
Roc |
|
|
7 |
|
Roc |
|
|
7 |
|
Preparation of shoe prior to testing
The right shoe of each pair was selected for testing while the left shoe was cut lengthwise so that the methods and materials of construction could be inspected. The thickness and hardness of the heel and forefoot were measured on the sectioned shoe.
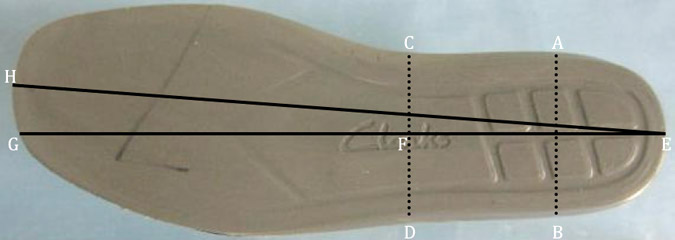
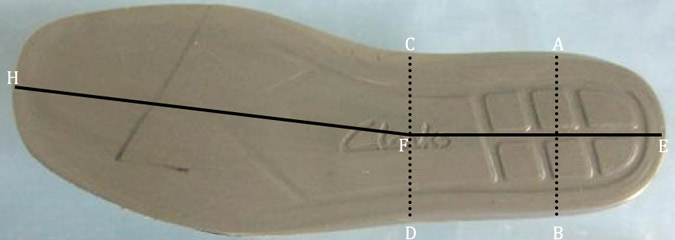
The insole of each shoe was used as a template to produce a guide for sectioning the shoe. On the insole, the long axis of the heel was marked and the angle of the last determined, figure 1. The sectioning line was then marked as EFH, figure 2. The insole was subsequently cut and used as a template to mark the interior of the shoe prior to sectioning. The right shoe and insole of each pair were kept intact and used for testing.
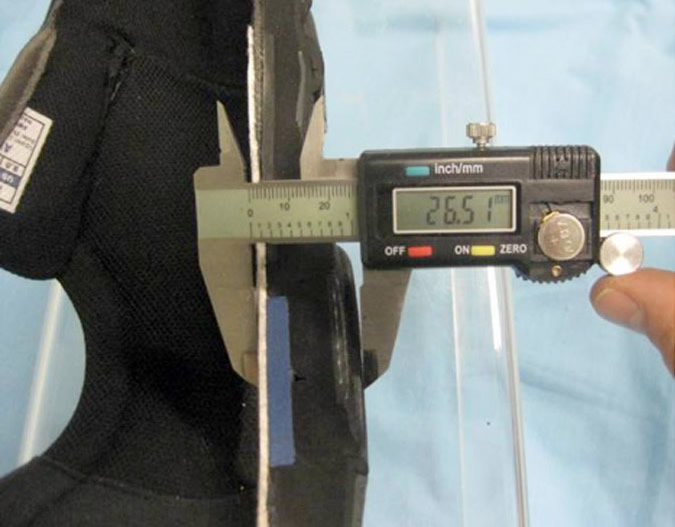
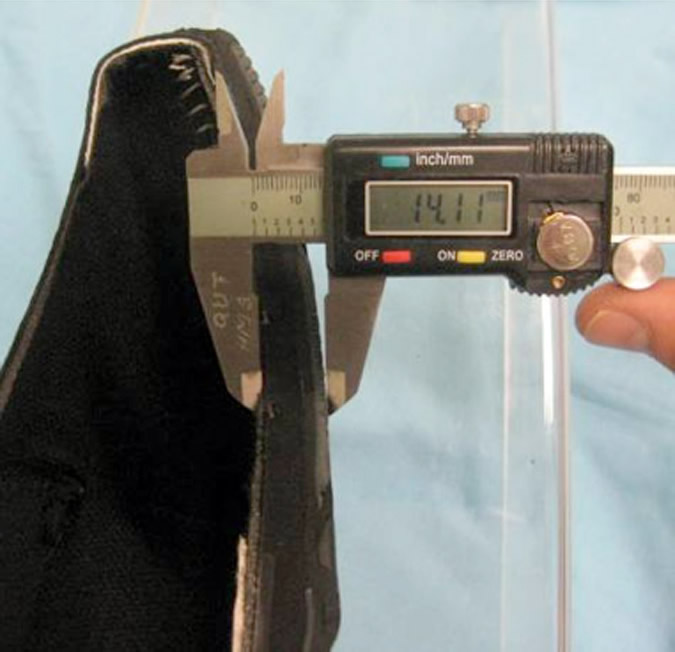
The thickness of the sole in the heel and forefoot regions was measured with a digital calliper, figure 3 & 4. The hardness of the heel and forefoot sections were measured with a TECLOCK GS-701 gauge and estimates (Shore hardness C) derived from at least three readings in each region.
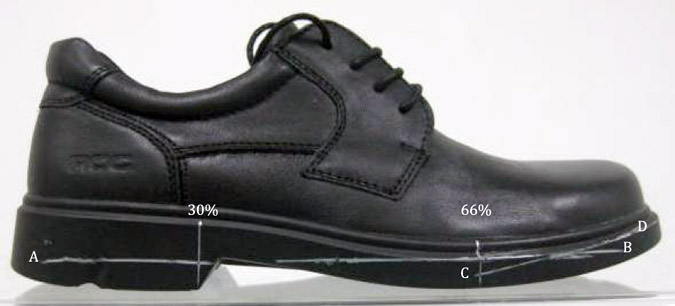
Prior to testing, the length of each right shoe was measured and the location of the leading edge of the heel determined as a proportion of the overall length. On average, for the group of 15 shoes, the leading edge of the heel was found to be located at 30% of the length, measured from the rear of the outer sole. In a similar way, the location of the forefoot flex region was determined to be at 66% of the length, figure 5. It should be noted that these regions cannot be determined exactly for every shoe because of the varied designs and constructions that are encountered. For example, in shoes with a wedged outer sole there is no leading edge to the heel. Overall, the values of 30% and 66% were considered to best represent the average for the group and were therefore used to mark the shoes prior to testing. The length-marks were subsequently used to position the shoe precisely on each test rig thereby ensuring maximum consistency throughout the tests.
In addition to the lengthwise divisions, the side of the sole was marked with two lines. The first was horizontal, parallel to the supporting surface, and crossed from the heel to the forefoot flex region. The second was parallel to the inherent toe-spring of the shoe, following the general line of the forefoot region, figure 5. These lines were used as references for measuring angular deviations when the shoe was subjected to bending.
Midsole Bend test
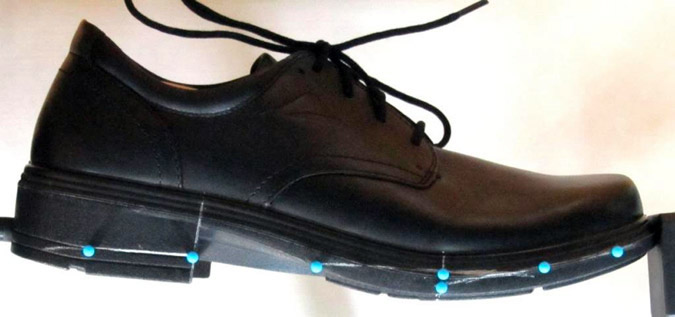
The midsole bend test was undertaken to determine whether an otherwise unconstrained shoe would bend primarily at the forefoot flex region when subjected to a longitudinal compressive load, or whether significant amounts of bending would occur at other regions, such as the midfoot. Pins were inserted into the medial aspect of sole, along the lines which had been previously marked on each shoe, figure 6.

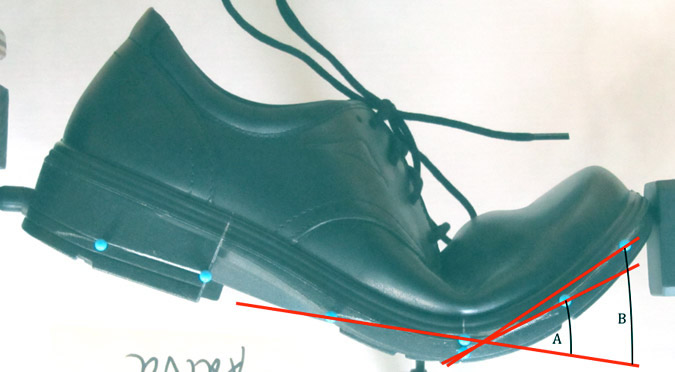
The shoe was loaded until significant bending could be observed and then photographed. Four angles were subsequently measured from the photograph. These represented the bends between the heel and midfoot, for the first half of the midfoot region and the entire midfoot region; flex angles 1 and 2 respectively. And, the bends at the metatarsal flex region for the first half of the forefoot region and the entire forefoot region, ; flex angles 3 and 4 respectively. The angular measurements were subsequently expressed as a percentage of the total bend as measured between the heel and forefoot.
Forefoot Flex test
The forefoot flex test was undertaken to determine the stiffness of the shoe in the flex region of the forefoot. Generally, the flex region in the forefoot of the shoe aligns approximately with an arc running through the metatarsophalangeal joints of the foot. This region of the shoe flexes during the latter part of the stance phase as the heel rises from the ground.
A rig was constructed with a hinge mechanism in such a way that force could be applied to the outer sole of the forefoot of the shoe while the heel and midfoot sections were clamped, via a shortened last, to prevent motion, figure 9.
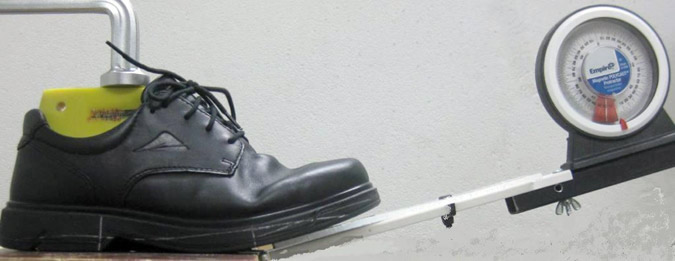
The shoe was positioned in the rig so that the hinge was aligned with the region of metatarsal flex (66% length mark of the shoe). Torque, centred at the axis of the hinge mechanism, was applied to the shoe via a lever. The magnitude of the applied torque was determined as force x distance, where the force was measured by a load cell and the distance was the distance from the hinge to a set point along the lever. Torque was recorded at three flex positions, 5o, 10o, and 15o, with the start position (0o) being the inherent toe spring formed at manufacture.
Midsole Torque test
The midsole torque test was undertaken to determine the torsional stiffness of the middle section of the shoe between the front edge of the heel and the metatarsal break (30%-66% marks).
A rig was constructed with a rotatable platform on which the forefoot of the shoe could be constrained by means of an adjustable strap while the heel was clamped to prevent motion, figures 10 & 11.
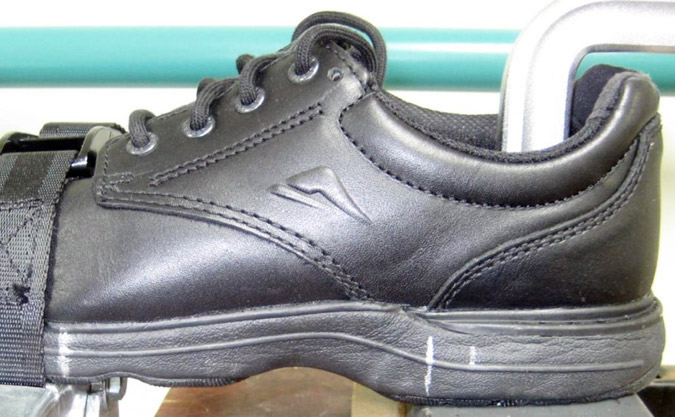
Collapse of the toe box was minimised by inserting a stiff foam plug into the shoe prior to tightening the strap. The shoe was positioned in the rig so that the axis of rotation of the rotatable platform was aligned with the central long axis of the shoe, while its rear edge was aligned with the 66% length mark. Torque, centred at the axis of the platform, was applied to the shoe via a lever extending from the platform, figure 11.

The magnitude of the applied torque was determined in a similar manner to the forefoot flex test (force x distance, where the force was measured by a load cell and the distance was the distance from the hinge to a set point along the lever). Torque was recorded at three positions; 5o, 10o, and 15o. The shoe was only subjected to torques which inverted the forefoot.
Heel Counter Stiffness test
The heel counter stiffness test was undertaken to determine the stiffness of the heel counter when subjected to a force applied to its rear.
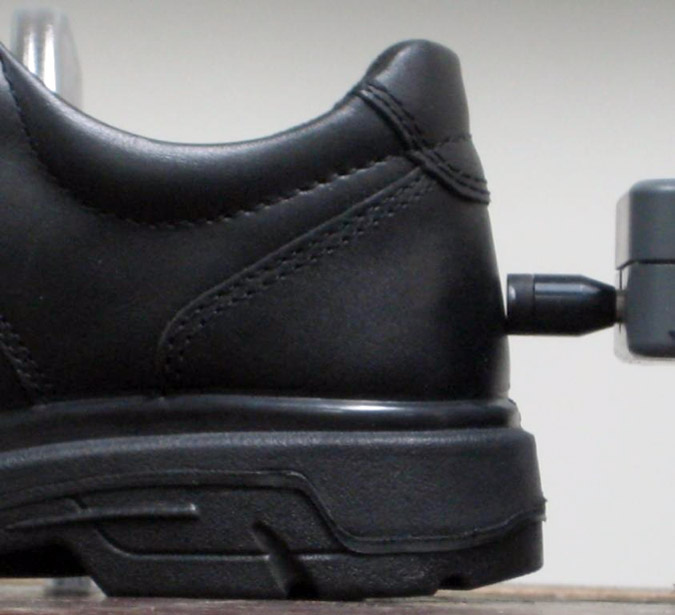
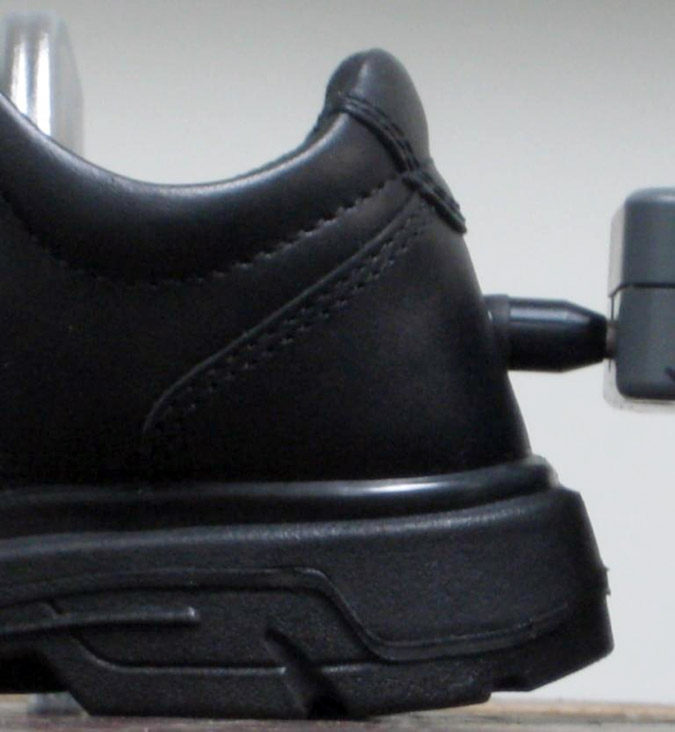
A rig was constructed such that a localised force could be applied to the heel counter via a circular, soft faced, indenter (contact area = 1 cm2) attached to a load cell. The shoe was constrained from moving by a clamp that exerted a distributed load through the midsection and heel. Horizontal load, parallel to the supporting surface of the heel, was applied to the external surface of the counter. The indenter was positioned 25mm above the interior height of the heel seat for shoes in the Youth group and 30mm for the Senior group, figure 12.
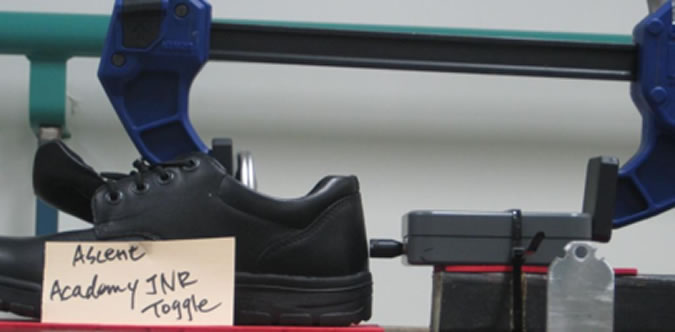
The counter was step-loaded (five sequential, discrete increments, each of approximately 3.8mm) until a horizontal displacement of approximately 19 mm was reached. The linear displacement and force were recorded for each increment. Examples of the heel counter displacements for minimum and maximum load are given in figures 13 & 14.
Results
The construction details, thickness and hardness of the heel and forefoot are given in tables 2 & 3.
Table 2 General construction characteristics: Youth Group
HT=Heel thickness (mm), FT=Forefoot thickness (mm), HH= Heel hardness, FH= Forefoot hardness. Hardness: Shore C durometer.
Youth Group |
|||||||
|
Lasting method |
Shank |
Heel construction |
HT (mm) |
FT (mm) |
HH Shore |
FH Shore |
combination |
plastic |
foam insert |
26 |
13 |
49 |
55 |
|
slip |
board/plastic combination |
foam insert |
26 |
13.5 |
35 |
42 |
|
slip |
plastic |
solid |
21 |
12 |
50 |
49 |
|
slip |
steel |
chambered |
27.5 |
13 |
53 |
62 |
|
slip |
steel |
chambered |
25 |
10 |
56 |
66 |
|
slip |
steel |
chambered |
30 |
12.5 |
58 |
60 |
|
slip |
plastic |
solid |
24.5 |
14 |
32 |
60 |
|
Table 3 General construction characteristics:
Senior Group HT=Heel thickness (mm), FT=Forefoot thickness (mm), HH= Heel hardness, FH= Forefoot hardness. Hardness: Shore C durometer.
Senior Group |
|||||||
|
Lasting method |
Shank type |
Heel construction |
HT (mm) |
FT (mm) |
HH Shore |
FH Shore |
slip |
plastic |
foam insert |
32 |
13 |
52 |
60 |
|
combination |
plastic |
foam insert |
27 |
16 |
47 |
52 |
|
slip |
board/plastic combination |
foam insert |
28 |
15 |
40 |
52 |
|
slip |
steel |
chambered |
32 |
13 |
47 |
61 |
|
board |
steel |
chambered |
31 |
16 |
57 |
65 |
|
slip |
steel |
chambered |
26 |
12 |
55 |
68 |
|
slip |
plastic |
solid |
27 |
14 |
40 |
52 |
|
slip |
steel |
chambered |
27 |
11 |
62 |
65 |
|
Midsole Bend test
The mean overall bend for the Youth group was 59o, and the range was 52o to 71o.
The mean overall bend for the Senior group was 51o, and the range was 44o to 60o.
For both the Youth and Senior groups the mean bend in the midfoot and metatarsal flex regions was approximately 8.5% and 77%, respectively. However, in the forefoot, beyond the metatarsal flex region, the Youth group demonstrated a mean bend of 9.5% compared with approximately 7% for the Senior group.
Midsole bend graphs for the Youth and Senior groups are shown in figures 15 & 16, respectively.
Forefoot Flex test
For the Youth group at 15o of flexion the mean torque was 2.7Nm, and the range was 2.1Nm to 3.3Nm.
For the Senior group at 15o of flexion the mean torque was 3.5Nm, and the range was 2.0Nm to 4.5Nm.
Forefoot flex stiffness graphs for the Youth and Senior groups are shown in figures 17 & 18, respectively.
Midsole Torque test
For the Youth group at 15o of twist the mean torque was 5.0Nm, and the range was 3.7Nm to 6.5Nm.
For the Senior group at 15o of twist the mean torque was 6.0Nm, and the range was 3.6Nm to 7.6Nm.
Midsole torque stiffness graphs for the Youth and Senior groups are shown in figures 19 & 20, respectively.
Heel Counter Stiffness test
For the Youth group, the mean peak force required to displace the heel counter approximately 19mm was 91.7N, and the range was 51.7N to 130.8N.
For the Senior group, the mean peak force required to displace the heel counter approximately 19mm was 91.0N, and the range was 53.3N to 144.2N.
Heel counter stiffness graphs for the Youth and Senior groups are shown in figure 21 & 22, respectively.
Summary
Midsole bend
No shoe demonstrated a substantial bend in the first half of the midfoot region. No shoe in either group demonstrated a midfoot bend in excess of 7o, even when the full length of the midfoot section was assessed. All shoes flexed predominantly at the metatarsal region which, on average, accounted for approximately 75% of the total bend; the Youth group ranged from 65.5% to 84.5%, while the Senior group ranged from 52% to 80%.
The terminal section of the forefoot region facilitated about 10% or 15% of the total bend in a shoe, Youth and Senior group respectively. Substantial variation was observed in the forefoot section; the Youth group ranged from 2.8% to 19.2% while the Senior group ranged from 6.7% to 34.1%. The Ascent Apex Senior demonstrated the least conventional bend profile with reduced metatarsal flex and increased tip flex. The flex region of the sole appeared to be designed intentionally to limit flexing on the medial side beneath the first metatarsal.
Forefoot flex
For the Youth group, the stiffest shoe was, on average, about 1.2x stiffer than the group mean and 1.5x stiffer than the least stiff shoe. For the Senior group, the stiffest shoe was, on average, about 1.3x stiffer than the group mean and 2.1x stiffer than the least stiff shoe.
Midsole torque
For the Youth group, the stiffest shoe was, on average, about 1.3x stiffer than the group mean and 1.7x stiffer than the least stiff shoe. For the Senior group, the stiffest shoe was, on average, about 1.3x stiffer than the group mean and 1.9x stiffer than the least stiff shoe.
Heel counter stiffness
For the Youth group, the stiffest shoe required, on average, about 1.6x more force to produce equal displacement than the group mean and 3x more force than the least stiff shoe. For the Senior group, the stiffest shoe required, on average, about 1.8x more force to produce equal displacement than the group mean and 3.6x more force than the least stiff shoe.
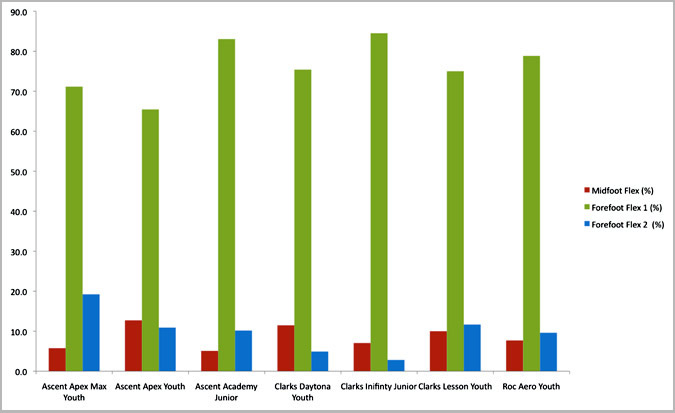
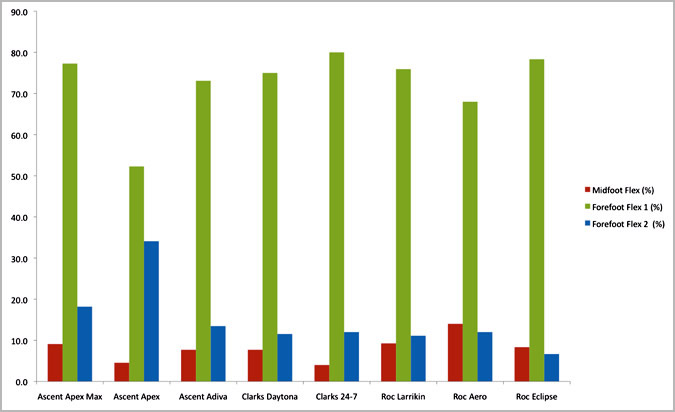
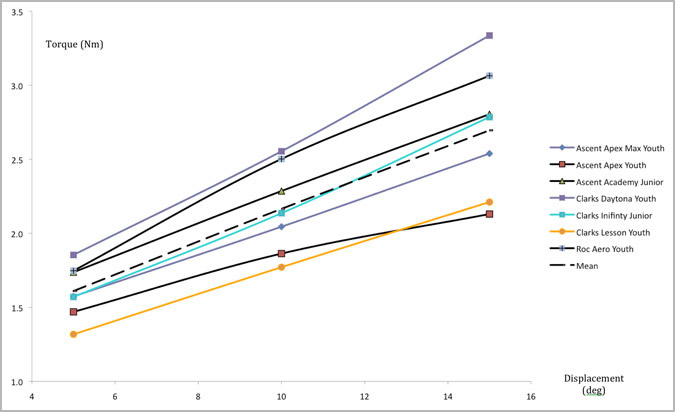
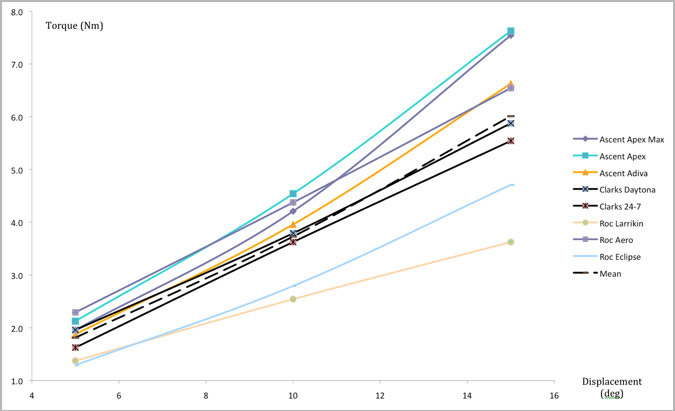
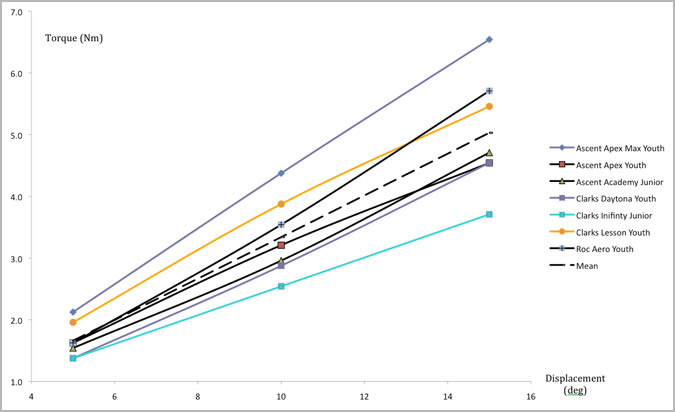

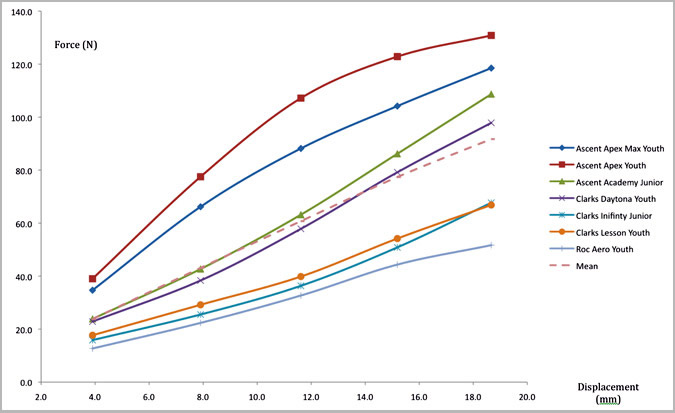
Table 4 Summary of characteristics and findings: Youth Group
1 Counter stiffness score and rank: derived as the sum of the scores for the test (quasi area under the curve), highest score considered to indicate stiffest counter and ranked 1, lowest score ranked 7.
2 Forefoot flex score and rank: derived as the sum of the scores for the test (quasi area under the curve), lowest score considered to indicate most flexible metatarsal break and ranked 1, highest score ranked 7.
3 Torsional stiffness score and rank: derived as the sum of the scores for the test (quasi area under the curve), highest score considered to indicate stiffest mid-section and ranked 1, lowest score ranked 7.
Click here to view the summary of characteristics & findings: Youth Group
Table 5 Summary of characteristics and findings: Senior Group
1 Counter stiffness score and rank: derived as the sum of the scores for the test (quasi area under the curve), highest score considered to indicate stiffest counter and ranked 1, lowest score ranked 7.
2 Forefoot flex score and rank: derived as the sum of the scores for the test (quasi area under the curve), lowest score considered to indicate most flexible metatarsal break and ranked 1, highest score ranked 7.
3 Torsional stiffness score and rank: derived as the sum of the scores for the test (quasi area under the curve), highest score considered to indicate stiffest mid-section and ranked 1, lowest score ranked 7.
Click here to view the summary of characteristics & findings: Senior Group
Background
Report commissioned by Dominion Cross Pty Ltd for the purpose of objective third party testing of key formal school shoe styles on the Australian market.
References
1. 2010 School Shoe Review. Ascent Shoes, 2010
2. Menz H, and Sherrington C. The footwear assessment form: A reliable clinical tool to assess footwear characteristics of relevance to postural stability in older adults. Clin Rehabil 2000, 14: 657-664.
3. Barton CJ, Bonanno D, and Menz H. Development and evaluation of a tool for the assessment of footwear characteristics. J Foot Ankle Res 2009, 2:10
4. Tanaka K, Uwai H, and Ujihashi S. A method of measurement and evaluation of the mechanical properties on the stability of running shoes. 6th International Symposium Footwear Biomechanics Group, Queenstown, 2003.
5. Hillstrom H, Song J, Heilman B, and Richards C. A method for testing torsional and toe break flexibilities. 7th International Symposium Footwear Biomechanics Group, Cleveland, 2005.